# Manage events using the GUI
With the GUI, you can:
* [View events](#view-events)
* [Filter events](#filter-events)
## View events
The events enable you to investigate issues that occur in the system.
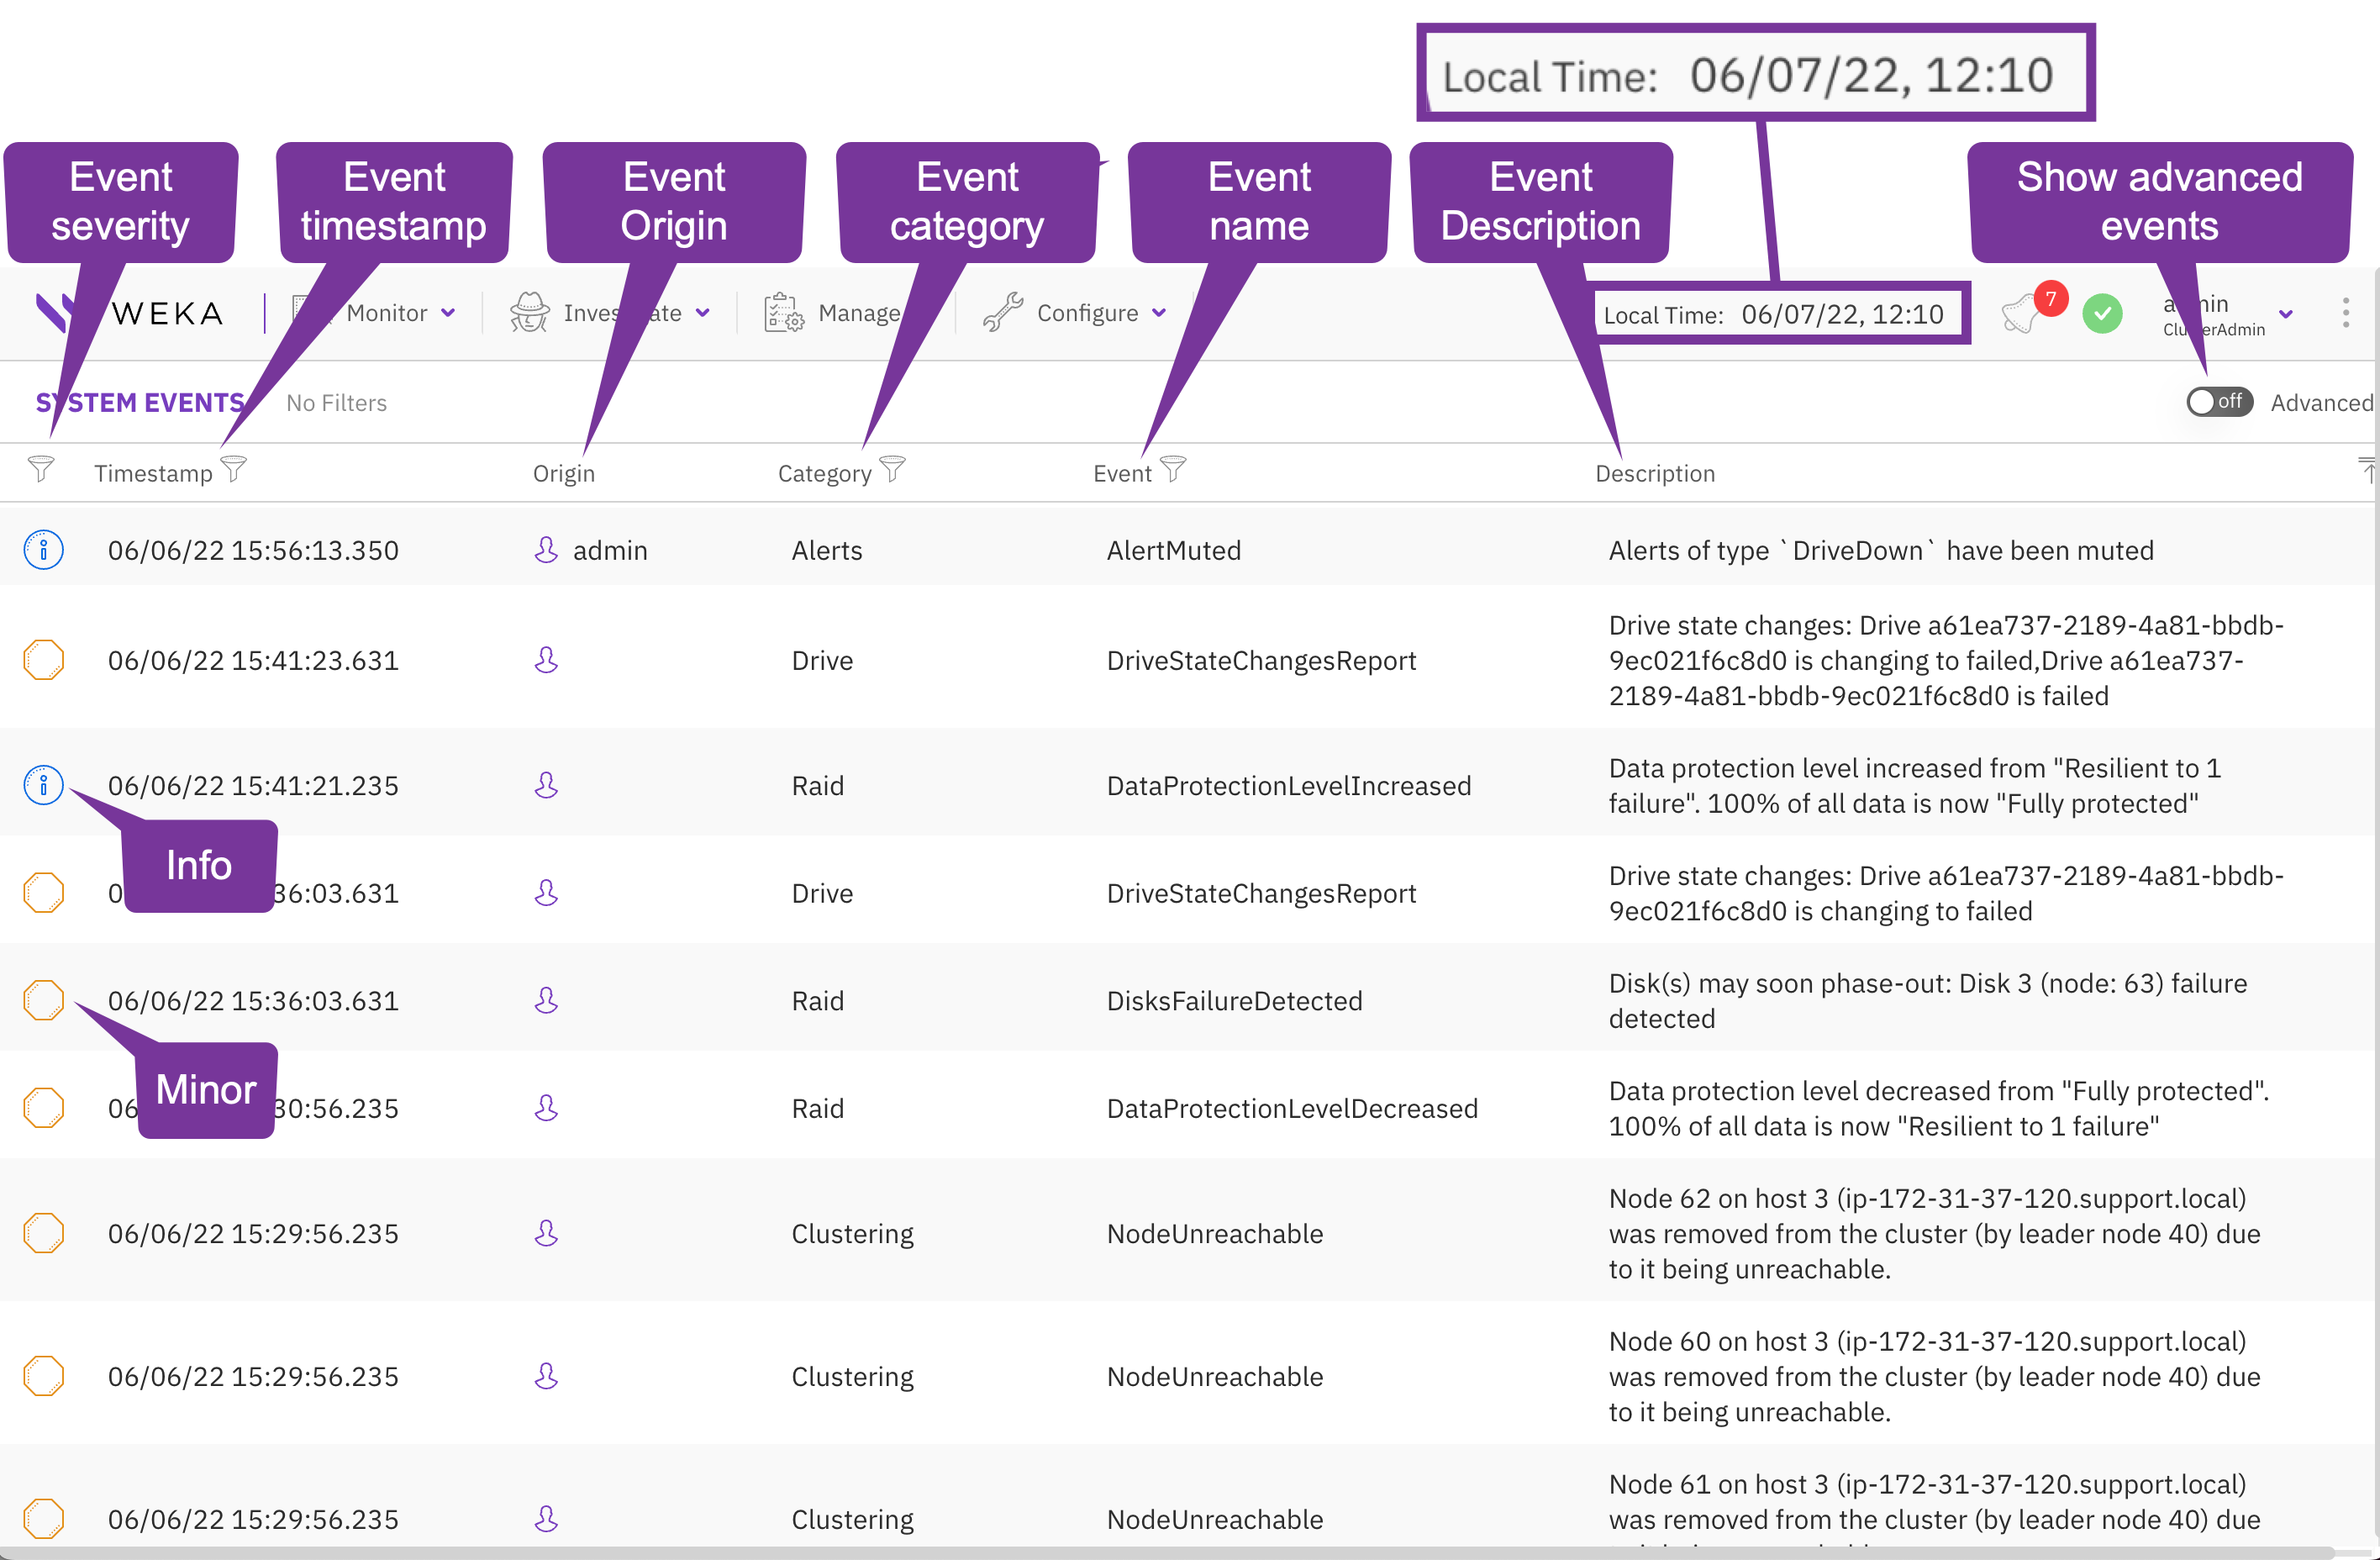
The System Events page provides the following details:
* **Severity**: The severity of the event. The options are Info (lowest), Warning, Minor, Major, and Critical (highest).
* **Timestamp**: The date and time the event occurred. You can switch the display time between local and system time through the top bar.
* **Process ID:** The process ID created the event.
* **Origin**: The event's originator, such as a user, backend, or cluster. For example, when a user creates a filesystem, the username appears as the event's originator.
* **Category**: The category options include Alerts, Cloud, Clustering, Config, Custom, Drive, Events, Filesystem, InterfaceGroup, Kms, Licensing, NFS, Network, Node, ObjectStorage, Org, Raid, Resources, S3, Security, Smb, System, Traces, Upgrade, and User.
* **Name**: The name of the event.
* **Description**: The description of the event.
You can select the **Advanced** switch to display internal events. This option is helpful for experts investigating internal issues.
**Procedure**
1. From the menu, select **Investigate > Events**.
## Filter events
You can filter the events according to the event severity, timestamp, category, or event name. You can also filter events by multiple categories and multiple event names.
#### Procedures
Display events of a specific minimum severity
1. Select the filter icon of the **Severity** column.
2. Select the required minimum severity.\
For example, the Critical events are displayed if you select the Major severity.
Display events of a specific period
1. Select the filter icon of the **Timestamp** column.
2. In the **From** field, select the timestamp of the beginning of the period to display.
3. In the **To** field, select the timestamp of the end of the period to display or select **Now**.
4. Select **OK**.
5. Select **Filter**.
Display events of specific categories
1. Select the filter icon of the **Category** column.
2. In the **Filter Categories**, select the category you want to display. You can select multiple categories.
3. Select **Filter**.
Display events with specific event names
1. Select the filter icon of the **Event** column.
2. In the **Events Filter**, select the event name you want to display. You can select multiple event names.
3. Select **Filter**.
## Display events by a predefined template
You can display events according to predefined templates based on a combination of event names with the same logical context. For example, selecting the **Processes** template displays all events related to processes. A predefined template enables focusing on certain areas of the system.
The predefined templates include protocols, object store, cluster-wide tasks, filesystems, quota, snapshots, clients, and processes.
Display events by a predefined template
**Procedure**
1. In the Events page, select **Predefined Templates.**
2. Select from the list the required template to display.
**Related topic**
[#switch-the-display-time](https://docs.weka.io/5.0/getting-started-with-weka/manage-the-system-using-weka-gui#switch-the-display-time "mention")