W E K A
4.4
4.4
  • WEKA v4.4 documentation
    • Documentation revision history
  • WEKA System Overview
    • Introduction
      • WEKA system functionality features
      • Converged WEKA system deployment
      • Redundancy optimization in WEKA
    • SSD capacity management
    • Filesystems, object stores, and filesystem groups
    • WEKA networking
    • Data lifecycle management
    • WEKA client and mount modes
    • WEKA containers architecture overview
    • Glossary
  • Planning and Installation
    • Prerequisites and compatibility
    • WEKA cluster installation on bare metal servers
      • Plan the WEKA system hardware requirements
      • Obtain the WEKA installation packages
      • Install the WEKA cluster using the WMS with WSA
      • Install the WEKA cluster using the WSA
      • Manually install OS and WEKA on servers
      • Manually prepare the system for WEKA configuration
        • Broadcom adapter setup for WEKA system
        • Enable the SR-IOV
      • Configure the WEKA cluster using the WEKA Configurator
      • Manually configure the WEKA cluster using the resources generator
        • VLAN tagging in the WEKA system
      • Perform post-configuration procedures
      • Add clients to an on-premises WEKA cluster
    • WEKA Cloud Deployment Manager Web (CDM Web) User Guide
    • WEKA Cloud Deployment Manager Local (CDM Local) User Guide
    • WEKA installation on AWS
      • WEKA installation on AWS using Terraform
        • Terraform-AWS-WEKA module description
        • Deployment on AWS using Terraform
        • Required services and supported regions
        • Supported EC2 instance types using Terraform
        • WEKA cluster auto-scaling in AWS
        • Detailed deployment tutorial: WEKA on AWS using Terraform
      • WEKA installation on AWS using the Cloud Formation
        • Self-service portal
        • CloudFormation template generator
        • Deployment types
        • AWS Outposts deployment
        • Supported EC2 instance types using Cloud Formation
        • Add clients to a WEKA cluster on AWS
        • Auto scaling group
        • Troubleshooting
    • WEKA installation on Azure
      • Azure-WEKA deployment Terraform package description
      • Deployment on Azure using Terraform
      • Required services and supported regions
      • Supported virtual machine types
      • Auto-scale virtual machines in Azure
      • Add clients to a WEKA cluster on Azure
      • Troubleshooting
      • Detailed deployment tutorial: WEKA on Azure using Terraform
    • WEKA installation on GCP
      • WEKA project description
      • GCP-WEKA deployment Terraform package description
      • Deployment on GCP using Terraform
      • Required services and supported regions
      • Supported machine types and storage
      • Auto-scale instances in GCP
      • Add clients to a WEKA cluster on GCP
      • Troubleshooting
      • Detailed deployment tutorial: WEKA on GCP using Terraform
      • Google Kubernetes Engine and WEKA over POSIX deployment
    • WEKA installation on OCI
  • Getting Started with WEKA
    • Manage the system using the WEKA GUI
    • Manage the system using the WEKA CLI
      • WEKA CLI hierarchy
      • CLI reference guide
    • Run first IOs with WEKA filesystem
    • Getting started with WEKA REST API
    • WEKA REST API and equivalent CLI commands
  • Performance
    • WEKA performance tests
      • Test environment details
  • WEKA Filesystems & Object Stores
    • Manage object stores
      • Manage object stores using the GUI
      • Manage object stores using the CLI
    • Manage filesystem groups
      • Manage filesystem groups using the GUI
      • Manage filesystem groups using the CLI
    • Manage filesystems
      • Manage filesystems using the GUI
      • Manage filesystems using the CLI
    • Attach or detach object store buckets
      • Attach or detach object store bucket using the GUI
      • Attach or detach object store buckets using the CLI
    • Advanced data lifecycle management
      • Advanced time-based policies for data storage location
      • Data management in tiered filesystems
      • Transition between tiered and SSD-only filesystems
      • Manual fetch and release of data
    • Mount filesystems
      • Mount filesystems from Single Client to Multiple Clusters (SCMC)
      • Manage authentication across multiple clusters with connection profiles
    • Snapshots
      • Manage snapshots using the GUI
      • Manage snapshots using the CLI
    • Snap-To-Object
      • Manage Snap-To-Object using the GUI
      • Manage Snap-To-Object using the CLI
    • Snapshot policies
      • Manage snapshot policies using the GUI
      • Manage snapshot policies using the CLI
    • Quota management
      • Manage quotas using the GUI
      • Manage quotas using the CLI
  • Additional Protocols
    • Additional protocol containers
    • Manage the NFS protocol
      • Supported NFS client mount parameters
      • Manage NFS networking using the GUI
      • Manage NFS networking using the CLI
    • Manage the S3 protocol
      • S3 cluster management
        • Manage the S3 service using the GUI
        • Manage the S3 service using the CLI
      • S3 buckets management
        • Manage S3 buckets using the GUI
        • Manage S3 buckets using the CLI
      • S3 users and authentication
        • Manage S3 users and authentication using the CLI
        • Manage S3 service accounts using the CLI
      • S3 lifecycle rules management
        • Manage S3 lifecycle rules using the GUI
        • Manage S3 lifecycle rules using the CLI
      • Audit S3 APIs
        • Configure audit webhook using the GUI
        • Configure audit webhook using the CLI
        • Example: How to use Splunk to audit S3
        • Example: How to use S3 audit events for tracking and security
      • S3 supported APIs and limitations
      • S3 examples using boto3
      • Configure and use AWS CLI with WEKA S3 storage
    • Manage the SMB protocol
      • Manage SMB using the GUI
      • Manage SMB using the CLI
  • Security
    • WEKA security overview
    • Obtain authentication tokens
    • Manage token expiration
    • Manage account lockout threshold policy
    • Manage KMS
      • Manage KMS using GUI
      • Manage KMS using CLI
    • Manage TLS certificates
      • Manage TLS certificates using GUI
      • Manage TLS certificates using CLI
    • Manage Cross-Origin Resource Sharing
    • Manage CIDR-based security policies
    • Manage login banner
  • Secure cluster membership with join secret authentication
  • Licensing
    • License overview
    • Classic license
  • Operation Guide
    • Alerts
      • Manage alerts using the GUI
      • Manage alerts using the CLI
      • List of alerts and corrective actions
    • Events
      • Manage events using the GUI
      • Manage events using the CLI
      • List of events
    • Statistics
      • Manage statistics using the GUI
      • Manage statistics using the CLI
      • List of statistics
    • Insights
    • System congestion
    • User management
      • Manage users using the GUI
      • Manage users using the CLI
    • Organizations management
      • Manage organizations using the GUI
      • Manage organizations using the CLI
      • Mount authentication for organization filesystems
    • Expand and shrink cluster resources
      • Add a backend server
      • Expand specific resources of a container
      • Shrink a cluster
    • Background tasks
      • Set up a Data Services container for background tasks
      • Manage background tasks using the GUI
      • Manage background tasks using the CLI
    • Upgrade WEKA versions
    • Manage WEKA drivers
  • Monitor the WEKA Cluster
    • Deploy monitoring tools using the WEKA Management Station (WMS)
    • WEKA Home - The WEKA support cloud
      • Local WEKA Home overview
      • Deploy Local WEKA Home v3.0 or higher
      • Deploy Local WEKA Home v2.x
      • Explore cluster insights
      • Explore performance statistics in Grafana
      • Manage alerts and integrations
      • Enforce security and compliance
      • Optimize support and data management
      • Export cluster metrics to Prometheus
    • Set up WEKAmon for external monitoring
    • Set up the SnapTool external snapshots manager
  • Kubernetes
    • Composable clusters for multi-tenancy in Kubernetes
    • WEKA Operator deployment
    • WEKA Operator day-2 operations
  • WEKApod
    • WEKApod Data Platform Appliance overview
    • WEKApod servers overview
    • Rack installation
    • WEKApod initial system setup and configuration
    • WEKApod support process
  • AWS Solutions
    • Amazon SageMaker HyperPod and WEKA Integrations
      • Deploy a new Amazon SageMaker HyperPod cluster with WEKA
      • Add WEKA to an existing Amazon SageMaker HyperPod cluster
    • AWS ParallelCluster and WEKA Integration
  • Azure Solutions
    • Azure CycleCloud for SLURM and WEKA Integration
  • Best Practice Guides
    • WEKA and Slurm integration
      • Avoid conflicting CPU allocations
    • Storage expansion best practice
  • Support
    • Get support for your WEKA system
    • Diagnostics management
      • Traces management
        • Manage traces using the GUI
        • Manage traces using the CLI
      • Protocols debug level management
        • Manage protocols debug level using the GUI
        • Manage protocols debug level using the CLI
      • Diagnostics data management
  • Appendices
    • WEKA CSI Plugin
      • Deployment
      • Storage class configurations
      • Tailor your storage class configuration with mount options
      • Dynamic and static provisioning
      • Launch an application using WEKA as the POD's storage
      • Add SELinux support
      • NFS transport failback
      • Upgrade legacy persistent volumes for capacity enforcement
      • Troubleshooting
    • Convert cluster to multi-container backend
    • Create a client image
    • Update WMS and WSA
    • BIOS tool
Powered by GitBook
On this page
  • Before you begin
  • Server minimum requirements
  • Workflow: Install the WEKAmon package
  • 1. Obtain the WEKAmon package
  • 2. Set the WEKAmon authentication
  • 3. Run the install.sh script
  • 4. Edit the export.yml file
  • 5. Edit the quota-export.yml file
  • 6. Start the docker-compose containers
  • Integrate with an existing Grafana/Prometheus environment
  • 1. Obtain the WEKAmon package
  • 2. Import the dashboard JSON files
  • 3. Edit the export.yml and quota-export.yml files
  • 4. Run the exporter
  • Exporter configuration options in the export.yml file
  1. Monitor the WEKA Cluster

Set up WEKAmon for external monitoring

Configure WEKAmon to integrate Grafana and Prometheus for centralized monitoring of WEKA cluster metrics, logs, alerts, and statistics.

PreviousExport cluster metrics to PrometheusNextSet up the SnapTool external snapshots manager

Last updated 3 days ago

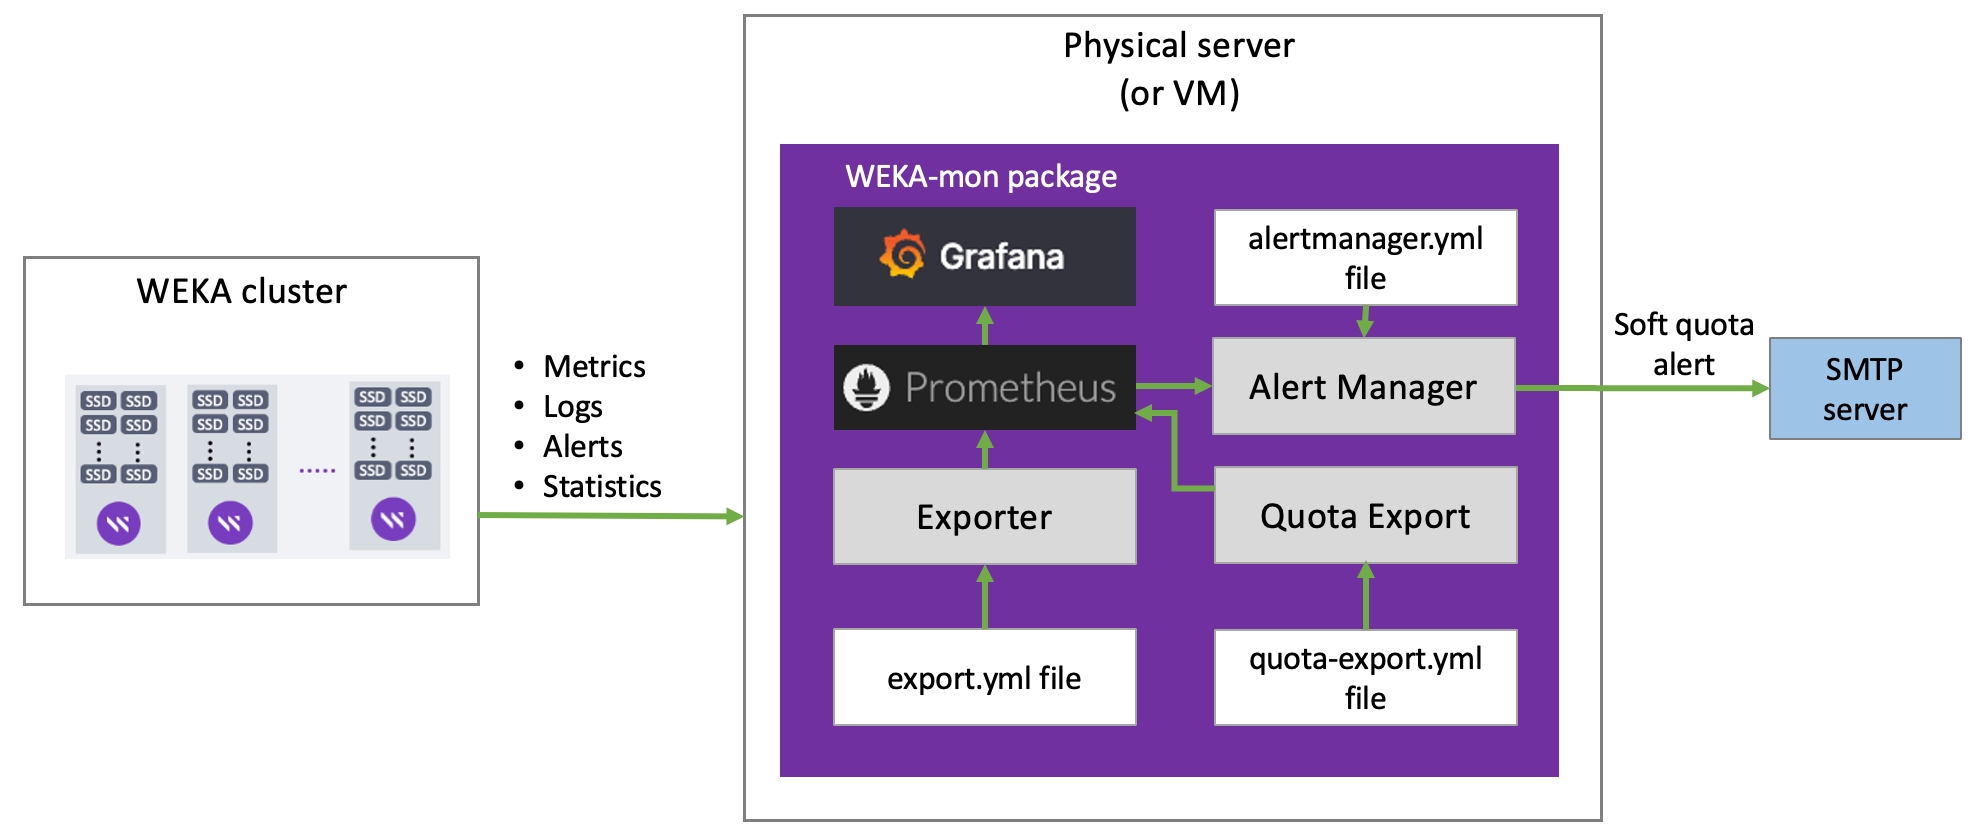
WEKAmon is an external monitoring package integrating and to provide a centralized metrics, logs, alerts, and statistics dashboard.

WEKAmon includes the following components:

  • Exporter: Collects data from the WEKA cluster and sends it to Prometheus.

  • Quota Export: Manages storage quotas and exports quota data to Prometheus.

  • Alert Manager: Sends alerts via SMTP when users approach soft quota limits.

You can set up WEKAmon independently of the WEKA GUI's built-in monitoring.

If you already use Grafana and Prometheus for other products, you can integrate WEKAmon to visualize all monitoring data on a unified dashboard.

If you have deployed the WMS, follow the procedure in:Deploy monitoring tools using the WEKA Management Station (WMS). Otherwise, continue with this workflow.

Before you begin

Setting up a dedicated physical server (or VM) for the installation is recommended.

Server minimum requirements

  • 4 cores

  • 16 GB RAM

  • 50 GB / partition (for the root)

  • 50 GB /opt/ partition (for WEKAmon installation)

  • 1 Gbps network

  • Docker is the recommended container for the WEKAmon setup. To use Docker, the following must be installed on the dedicated physical server (or VM):

    • docker-ce

    • docker-compose or docker-compose-plugin, depending on the existing operating system.

Workflow: Install the WEKAmon package

1. Obtain the WEKAmon package

The WEKAmon package resides on the GitHub repository. Obtain the WEKAmon package using one of the following methods:

Download the WEKAmon source code

It is recommended installing weka-mon in the /opt partition of the host server. If you choose a different location, make a note of the location and adjust the instructions accordingly.

  1. On the latest release section, select the Source Code link to download.

  2. Copy the downloaded source code to the host server and unpack it into /opt.

Clone the repository

  1. Run the following commands to clone the WEKAmon package from GitHub:

cd /opt
git clone https://github.com/weka/weka-mon
cd /opt/weka-mon

2. Set the WEKAmon authentication

For the WEKAmon host to communicate with the WEKA cluster, a security token is necessary. However, the WEKAmon host is not required to have the WEKA client installed.

Prepare WEKAmon user and token

Perform the following steps on an existing host with access to the WEKA CLI, for example, on a WEKA backend server.

  1. Create a dedicated user: Create a unique local username (for example, wekamon) for WEKAmon. The unique username is displayed in the event logs, making the identification and troubleshooting of issues easier. Then, assign the ClusterAdmin or OrgAdmin role. Example: weka user add wekamon clusteradmin

  2. Generate an authentication token for the user: Run the following command: weka user login wekamon --path wekamon-authtoken.json

  3. Transfer the token: Copy the wekamon-authtoken.json file to the WEKAmon management server. It will later be placed in a specific directory on that host.

  4. Remove the token file: Delete the wekamon-authtoken.json locally. Example: rm wekamon-authtoken.json

Configure WEKAmon host with authentication token

Perform the following steps on the WEKAmon host.

  • Prerequisite: Ensure the authentication token file (/weka/.weka/auth-token.json) is readable by the user running the WEKAmon container. If the container operates with restricted permissions, adjust the file permissions accordingly. Typically, you can determine the container’s user using docker inspect.

  • Create a directory for the authentication token: Run the following command:

    mkdir /opt/weka-mon/.weka

  • Move the previously-created authentication token into the new directory: : Run the following command: mv ~/wekamon-authtoken.json /opt/weka-mon/.weka/auth-token.json

  • Ensure appropriate ownership and permissions are set: Run the following commands: chown root:root /opt/weka-mon/.weka/auth-token.json chmod 400 /opt/weka-mon/.weka/auth-token.json

Related topics

Obtain authentication tokens

3. Run the install.sh script

The install.sh script creates a few directories and sets their permissions.

Run the following command:

./install.sh

4. Edit the export.yml file

The WEKAmon and exporter configuration are defined in the export.yml file.

  1. Change directory to /opt/weka-mon and open the export.yml file.

  2. In the cluster section under the hosts list, replace the hostnames with the actual hostnames/IP addresses of the Weka containers (up to three would be sufficient). Ensure the hostnames are mapped to the IP addresses in /etc/hosts.

hosts:
 - hostname01 
 - hostname02
 - hostname03
  1. Optional. Add custom panels to Grafana containing other metrics.

All other settings in the export.yml file have pre-defined defaults that do not need modification to work with WEKAmon. All the configurable items are defined but marked as comments by an asterisk (#).

To add custom panels to Grafana containing other metrics from the cluster, you can remove the asterisk from the required metrics (uncomment).

Example: In the following snippet of the export.yml, to enable getting the FILEATOMICOPEN_OPS statistic, remove the # character at the beginning of the line.

If the statistic you want to get is in a Category that is commented out, also uncomment the Category line (the first line in the example). Conversely, insert the # character at the beginning of the line to stop getting a statistic.

 'ops_driver':     # Category
   'DIRECT_READ_SIZES':  'sizes'
   'DIRECT_WRITE_SIZES':  'sizes'
#   'FILEATOMICOPEN_LATENCY':  'microsecs'
#   'FILEATOMICOPEN_OPS':  'ops'

5. Edit the quota-export.yml file

The WEKAmon deployment includes a dedicated container named quota-export. The container includes an Alert Manager that emails users when they reach their soft quota.

The configuration of the quota-export container is defined in the quota-export.yml file.

  1. Go to the weka-mon directory and open the quota-export.yml file.

6. Start the docker-compose containers

  1. Run the following command:

docker compose up -d

Some older docker versions require docker-compose up -d (note the dash between docker and compose).

  1. Verify that the containers are running using the following command:

docker ps

Example:

[root@av0412CL-3 weka-mon] 2022-12-05 17:30:37 $ docker ps
CONTAINER ID   IMAGE                               COMMAND                  CREATED          STATUS            PORTS                                       NAMES
ec1d2584acab   grafana/loki:2.3.0                  "/usr/bin/loki -conf…"   20 minutes ago   Up 20 minutes     0.0.0.0:3100->3100/tcp, :::3100->3100/tcp   weka-mon_loki_1
4645533501f0   grafana/grafana:latest              "/run.sh"                20 minutes ago   Up 20 minutes     0.0.0.0:3000->3000/tcp, :::3000->3000/tcp   weka-mon_grafana_1
d930e903b74e   wekasolutions/export:latest         "/weka/export -v"        20 minutes ago   Up 7 minutes      0.0.0.0:8001->8001/tcp, :::8001->8001/tcp   weka-mon_export_1
dc5f9f710997   wekasolutions/quota-export:latest   "/weka/quota-export"     20 minutes ago   Up 7 minutes      0.0.0.0:8101->8101/tcp, :::8101->8101/tcp   weka-mon_quota-export_1
17689ac9377d   prom/prometheus:latest              "/bin/prometheus --s…"   20 minutes ago   Up 20 minutes     0.0.0.0:9090->9090/tcp, :::9090->9090/tcp   weka-mon_prometheus_1
[root@av0412CL-3 weka-mon] 2022-12-05 17:35:46 $ 

If the status of the containers is not up, check the logs and troubleshoot accordingly. To check the logs, run the following command:

docker logs <container id>

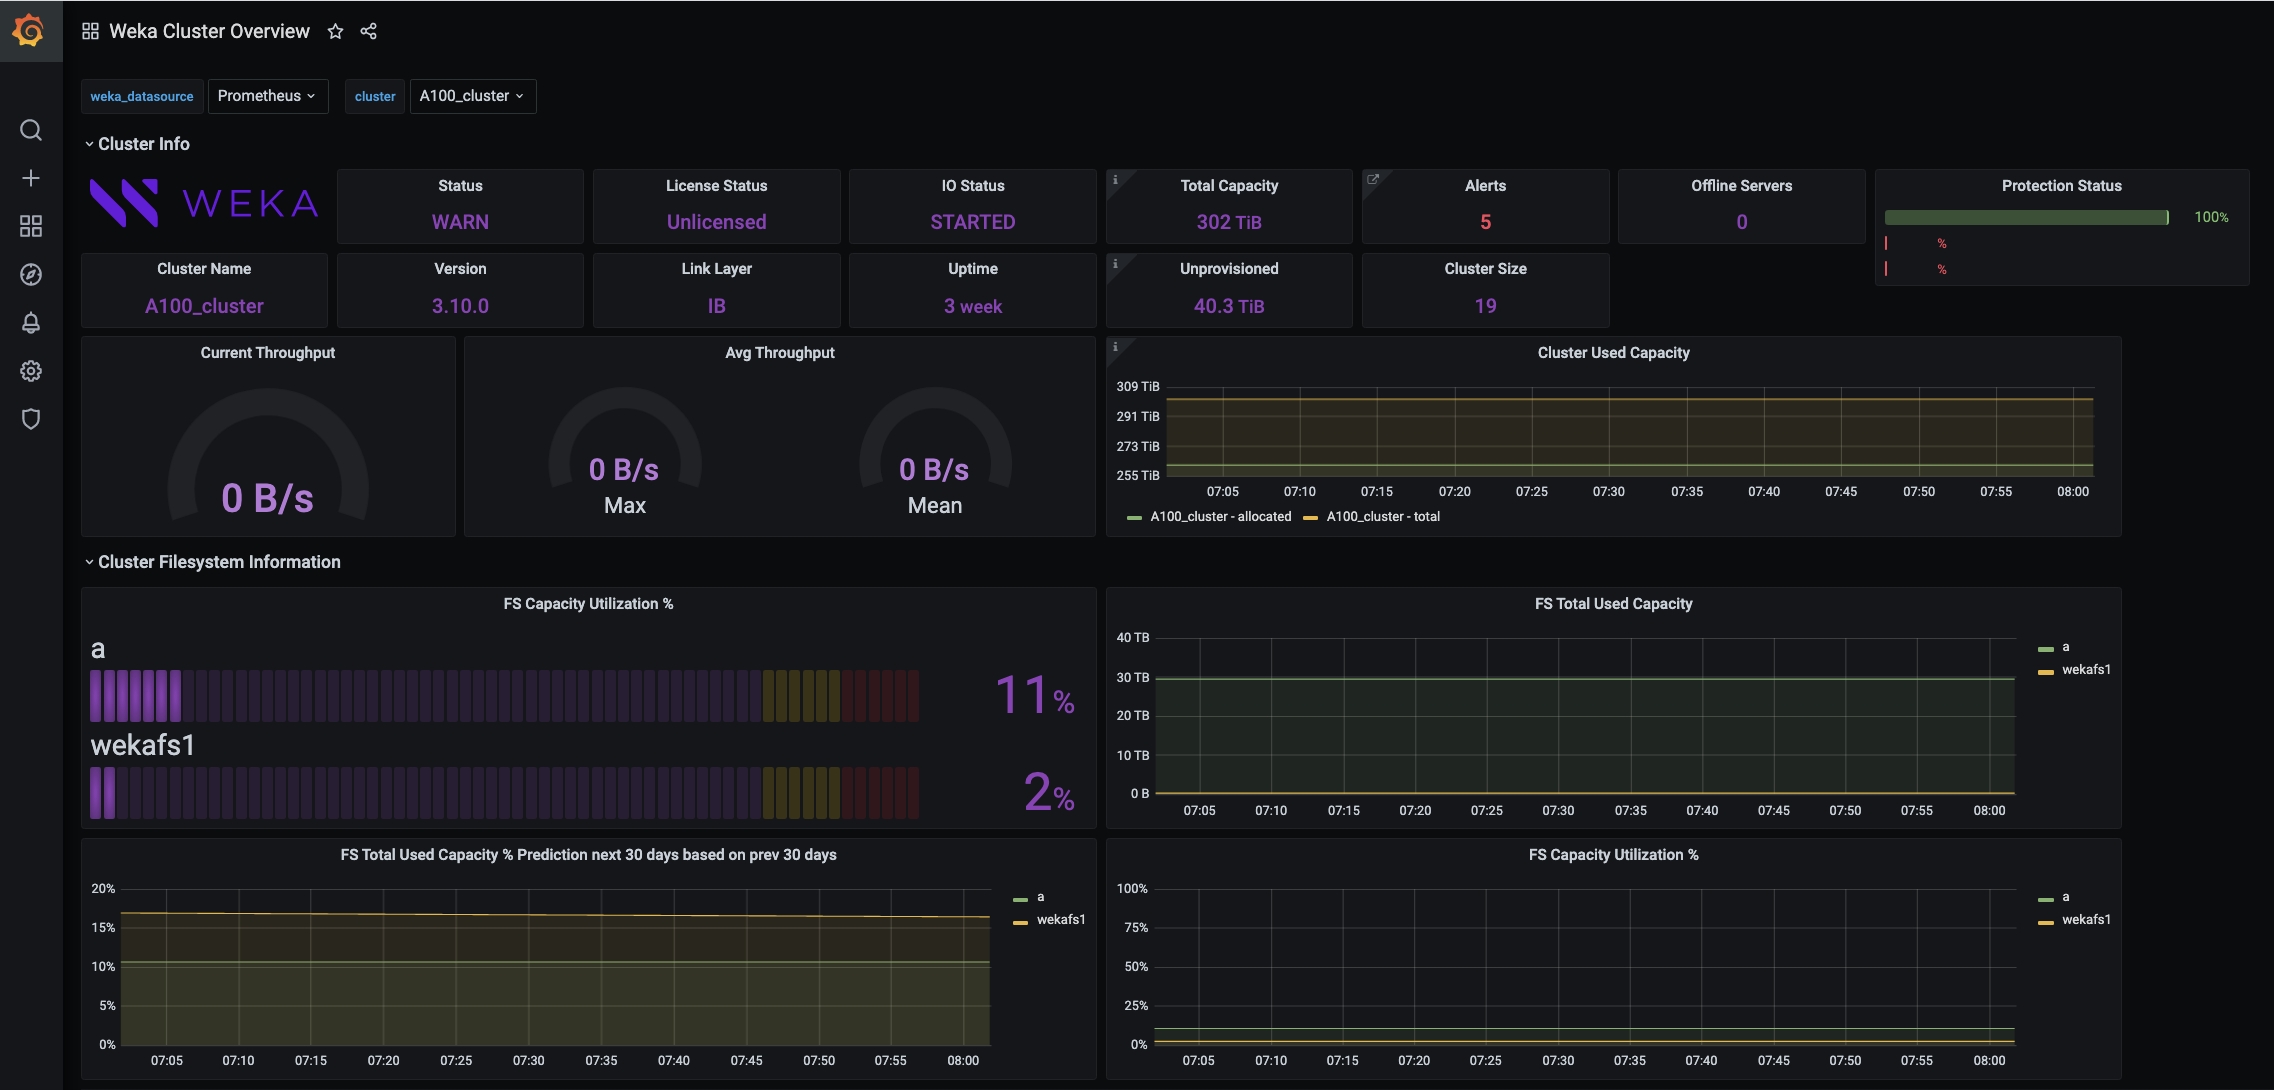
Once all containers run, you can connect to Grafana on port 3000 of the physical server running the docker containers. The default credentials for Grafana are admin/admin.

Integrate with an existing Grafana/Prometheus environment

If you already have Grafana and Prometheus running in your environment, you only need to run the exporter and add it to the Prometheus configuration.

1. Obtain the WEKAmon package

2. Import the dashboard JSON files

3. Edit the export.yml and quota-export.yml files

Perform the steps in the following sections above:

4. Edit the export.yml file

5. Edit the quota-export.yml file

4. Run the exporter

Do one of the following:

Run the exporter in the docker container

Get and run the container (the export.yml configuration file is already edited).

The following example maps the export.yml configuration file in several volumes in the container:

  • ~/.weka directory to enable the container to read the authentication file.

  • /dev/log to enable entries in the Syslog.

  • /etc/hosts to enable the hostname resolution (a DNS can also be used, if exists in the docker environment).

There are more options; you can run the command with-help or -h for a full description.

# get the container from dockerhub:
docker pull wekasolutions/export

# example of how to run the container
docker run -d --network=host \
  --mount type=bind,source=/root/.weka/,target=/weka/.weka/ \
  --mount type=bind,source=/dev/log,target=/dev/log \
  --mount type=bind,source=/etc/hosts,target=/etc/hosts \
  --mount type=bind,source=$PWD/export.yml,target=/weka/export.yml \
  wekasolutions/export -v

Run the exporter as a compiled binary

  1. Copy this file to the physical server (or VM).

tar xvf export-1.3.0.tar
cd export
./export -v

Run the exporter as a Python script

  1. Do one of the following:

    • Run git clone https://github.com/weka/export

  2. Install the required python modules by running the following command: pip3 install -r requirements.txt

./export -v

Exporter configuration options in the export.yml file

The exporter section defines the program behavior.

# exporter section
exporter:
  listen_port: 8001
  loki_host: loki
  loki_port: 3100
  timeout: 10.0
  max_procs: 8
  max_threads_per_proc: 100
  backends_only: True

Exporter section parameters

Parameter
Description

listen_port

The Prometheus listening port. Do not modify this port unless you modify the Prometheus configuration.

loki_host

If using the Weka-mon setup, do not modify the hostname. Leave blank to disable sending events to Loki.

loki_port

If using the Weka-mon setup, do not modify the port.

timeout

The max time in seconds to wait for an API call to return. The default value is sufficient for most purposes.

max_procs and max_threads_per_proc

Define the scaling behavior. If the number of hosts (servers and clients) exceeds max_threads_per_proc, the exporter runs more processes accordingly. Example: a cluster with 80 Weka servers and 200 compute nodes (aka clients) has 280 hosts. With the default max_threads_per_proc of 100, it runs 3 processes (280 / 100 ~ 3). It's recommended to have 1 available core per process. In this cluster example, deploy at least 4 available cores on the server/VM.

backends_only

Run only on the Weka backend hosts

The exporter always tries to allocate one host per thread but does not exceed the maximum processes specified in the max_procs parameter. In a cluster with 1000 hosts, it doubles or triples up the hosts on the threads.

Example:

In a cluster with 3000 hosts, max_procs = 8, and max_threads_per_proc= 100, only 8 processes running. Each process with 100 threads, but there are close to 4 hosts serviced per thread instead of the default 1 host.

For instructions on the Docker installation, see the .

: Obtain the WEKAmon package from the GitHub repository by downloading or cloning.

: Prepare WEKAmon user and token and configure WEKAmon host with authentication token.

: The script creates a few directories and sets their permissions.

The export.yml file contains the WEKAmon and the exporter configuration. Customize the file according to your actual WEKA deployment.

: The quota-export.yml file contains the configuration of the quota-export container. Customize the file according to your actual WEKA deployment.

: Once done, you can connect to Grafana on port 3000 of the physical server running the docker containers.

Go to

Optional. In the exporter section, customize the values according to your preferences. For details, see the topic below.

Specify the same hosts as you specified in the export.yml file (see ).

The configuration of the Alert Manager is defined in the alertmanager.yml file found in the etc_alertmanager directory. It contains details about the SMTP server, user email addresses, quotas, and alert rules. To set this file, contact the .

Follow the steps in the section.

In the Grafana application, import the dashboard JSON files from the directory weka-mon/var_lib_grafana/dashboards. For instructions, see the topic in Grafana documentation.

(if you have a docker, this is the simple method).

(if you do not have a docker, use this option)

(requires installing a few Python Modules from PyPi).

Go to and download the tarball from the latest release.

Run the exporter as follows (for the description of the command-line parameters, see the ):

Go to and download the source tarball.

Run the exporter (for the description of the command-line parameters, see the ):

Docker website
https://github.com/weka/weka-mon/releases.
Import dashboard
https://github.com/weka/export/releases
Obtain the WEKAmon package
Set the WEKAmon authentication
Run the install.sh script
Edit the export.yml file:
Edit the quota-export.yml file
Start the docker-compose containers
Download the WEKAmon source code
Clone the repository
Exporter configuration options
above
1. Obtain the WEKAmon package
Run the exporter in the docker container
Run the exporter as a compiled binary
Run the exporter as a Python script
Exporter section parameters
Create a local user
Customer Success Team
WEKAmon setup
WEKA monitoring data on the Grafana dashboard example