W E K A
4.4
4.4
  • WEKA v4.4 documentation
    • Documentation revision history
  • WEKA System Overview
    • Introduction
      • WEKA system functionality features
      • Converged WEKA system deployment
      • Redundancy optimization in WEKA
    • SSD capacity management
    • Filesystems, object stores, and filesystem groups
    • WEKA networking
    • Data lifecycle management
    • WEKA client and mount modes
    • WEKA containers architecture overview
    • Glossary
  • Planning and Installation
    • Prerequisites and compatibility
    • WEKA cluster installation on bare metal servers
      • Plan the WEKA system hardware requirements
      • Obtain the WEKA installation packages
      • Install the WEKA cluster using the WMS with WSA
      • Install the WEKA cluster using the WSA
      • Manually install OS and WEKA on servers
      • Manually prepare the system for WEKA configuration
        • Broadcom adapter setup for WEKA system
        • Enable the SR-IOV
      • Configure the WEKA cluster using the WEKA Configurator
      • Manually configure the WEKA cluster using the resources generator
        • VLAN tagging in the WEKA system
      • Perform post-configuration procedures
      • Add clients to an on-premises WEKA cluster
    • WEKA Cloud Deployment Manager Web (CDM Web) User Guide
    • WEKA Cloud Deployment Manager Local (CDM Local) User Guide
    • WEKA installation on AWS
      • WEKA installation on AWS using Terraform
        • Terraform-AWS-WEKA module description
        • Deployment on AWS using Terraform
        • Required services and supported regions
        • Supported EC2 instance types using Terraform
        • WEKA cluster auto-scaling in AWS
        • Detailed deployment tutorial: WEKA on AWS using Terraform
      • WEKA installation on AWS using the Cloud Formation
        • Self-service portal
        • CloudFormation template generator
        • Deployment types
        • AWS Outposts deployment
        • Supported EC2 instance types using Cloud Formation
        • Add clients to a WEKA cluster on AWS
        • Auto scaling group
        • Troubleshooting
    • WEKA installation on Azure
      • Azure-WEKA deployment Terraform package description
      • Deployment on Azure using Terraform
      • Required services and supported regions
      • Supported virtual machine types
      • Auto-scale virtual machines in Azure
      • Add clients to a WEKA cluster on Azure
      • Troubleshooting
      • Detailed deployment tutorial: WEKA on Azure using Terraform
    • WEKA installation on GCP
      • WEKA project description
      • GCP-WEKA deployment Terraform package description
      • Deployment on GCP using Terraform
      • Required services and supported regions
      • Supported machine types and storage
      • Auto-scale instances in GCP
      • Add clients to a WEKA cluster on GCP
      • Troubleshooting
      • Detailed deployment tutorial: WEKA on GCP using Terraform
      • Google Kubernetes Engine and WEKA over POSIX deployment
    • WEKA installation on OCI
  • Getting Started with WEKA
    • Manage the system using the WEKA GUI
    • Manage the system using the WEKA CLI
      • WEKA CLI hierarchy
      • CLI reference guide
    • Run first IOs with WEKA filesystem
    • Getting started with WEKA REST API
    • WEKA REST API and equivalent CLI commands
  • Performance
    • WEKA performance tests
      • Test environment details
  • WEKA Filesystems & Object Stores
    • Manage object stores
      • Manage object stores using the GUI
      • Manage object stores using the CLI
    • Manage filesystem groups
      • Manage filesystem groups using the GUI
      • Manage filesystem groups using the CLI
    • Manage filesystems
      • Manage filesystems using the GUI
      • Manage filesystems using the CLI
    • Attach or detach object store buckets
      • Attach or detach object store bucket using the GUI
      • Attach or detach object store buckets using the CLI
    • Advanced data lifecycle management
      • Advanced time-based policies for data storage location
      • Data management in tiered filesystems
      • Transition between tiered and SSD-only filesystems
      • Manual fetch and release of data
    • Mount filesystems
      • Mount filesystems from Single Client to Multiple Clusters (SCMC)
      • Manage authentication across multiple clusters with connection profiles
    • Snapshots
      • Manage snapshots using the GUI
      • Manage snapshots using the CLI
    • Snap-To-Object
      • Manage Snap-To-Object using the GUI
      • Manage Snap-To-Object using the CLI
    • Snapshot policies
      • Manage snapshot policies using the GUI
      • Manage snapshot policies using the CLI
    • Quota management
      • Manage quotas using the GUI
      • Manage quotas using the CLI
  • Additional Protocols
    • Additional protocol containers
    • Manage the NFS protocol
      • Supported NFS client mount parameters
      • Manage NFS networking using the GUI
      • Manage NFS networking using the CLI
    • Manage the S3 protocol
      • S3 cluster management
        • Manage the S3 service using the GUI
        • Manage the S3 service using the CLI
      • S3 buckets management
        • Manage S3 buckets using the GUI
        • Manage S3 buckets using the CLI
      • S3 users and authentication
        • Manage S3 users and authentication using the CLI
        • Manage S3 service accounts using the CLI
      • S3 lifecycle rules management
        • Manage S3 lifecycle rules using the GUI
        • Manage S3 lifecycle rules using the CLI
      • Audit S3 APIs
        • Configure audit webhook using the GUI
        • Configure audit webhook using the CLI
        • Example: How to use Splunk to audit S3
        • Example: How to use S3 audit events for tracking and security
      • S3 supported APIs and limitations
      • S3 examples using boto3
      • Configure and use AWS CLI with WEKA S3 storage
    • Manage the SMB protocol
      • Manage SMB using the GUI
      • Manage SMB using the CLI
  • Security
    • WEKA security overview
    • Obtain authentication tokens
    • Manage token expiration
    • Manage account lockout threshold policy
    • Manage KMS
      • Manage KMS using GUI
      • Manage KMS using CLI
    • Manage TLS certificates
      • Manage TLS certificates using GUI
      • Manage TLS certificates using CLI
    • Manage Cross-Origin Resource Sharing
    • Manage CIDR-based security policies
    • Manage login banner
  • Secure cluster membership with join secret authentication
  • Licensing
    • License overview
    • Classic license
  • Operation Guide
    • Alerts
      • Manage alerts using the GUI
      • Manage alerts using the CLI
      • List of alerts and corrective actions
    • Events
      • Manage events using the GUI
      • Manage events using the CLI
      • List of events
    • Statistics
      • Manage statistics using the GUI
      • Manage statistics using the CLI
      • List of statistics
    • Insights
    • System congestion
    • User management
      • Manage users using the GUI
      • Manage users using the CLI
    • Organizations management
      • Manage organizations using the GUI
      • Manage organizations using the CLI
      • Mount authentication for organization filesystems
    • Expand and shrink cluster resources
      • Add a backend server
      • Expand specific resources of a container
      • Shrink a cluster
    • Background tasks
      • Set up a Data Services container for background tasks
      • Manage background tasks using the GUI
      • Manage background tasks using the CLI
    • Upgrade WEKA versions
    • Manage WEKA drivers
  • Monitor the WEKA Cluster
    • Deploy monitoring tools using the WEKA Management Station (WMS)
    • WEKA Home - The WEKA support cloud
      • Local WEKA Home overview
      • Deploy Local WEKA Home v3.0 or higher
      • Deploy Local WEKA Home v2.x
      • Explore cluster insights
      • Explore performance statistics in Grafana
      • Manage alerts and integrations
      • Enforce security and compliance
      • Optimize support and data management
      • Export cluster metrics to Prometheus
    • Set up WEKAmon for external monitoring
    • Set up the SnapTool external snapshots manager
  • Kubernetes
    • Composable clusters for multi-tenancy in Kubernetes
    • WEKA Operator deployment
    • WEKA Operator day-2 operations
  • WEKApod
    • WEKApod Data Platform Appliance overview
    • WEKApod servers overview
    • Rack installation
    • WEKApod initial system setup and configuration
    • WEKApod support process
  • AWS Solutions
    • Amazon SageMaker HyperPod and WEKA Integrations
      • Deploy a new Amazon SageMaker HyperPod cluster with WEKA
      • Add WEKA to an existing Amazon SageMaker HyperPod cluster
    • AWS ParallelCluster and WEKA Integration
  • Azure Solutions
    • Azure CycleCloud for SLURM and WEKA Integration
  • Best Practice Guides
    • WEKA and Slurm integration
      • Avoid conflicting CPU allocations
    • Storage expansion best practice
  • Support
    • Get support for your WEKA system
    • Diagnostics management
      • Traces management
        • Manage traces using the GUI
        • Manage traces using the CLI
      • Protocols debug level management
        • Manage protocols debug level using the GUI
        • Manage protocols debug level using the CLI
      • Diagnostics data management
  • Appendices
    • WEKA CSI Plugin
      • Deployment
      • Storage class configurations
      • Tailor your storage class configuration with mount options
      • Dynamic and static provisioning
      • Launch an application using WEKA as the POD's storage
      • Add SELinux support
      • NFS transport failback
      • Upgrade legacy persistent volumes for capacity enforcement
      • Troubleshooting
    • Convert cluster to multi-container backend
    • Create a client image
    • Update WMS and WSA
    • BIOS tool
Powered by GitBook
On this page
  • Clusters
  • View clusters list
  • Filter clusters list
  • Download clusters report
  • Overview
  • Events
  • Filesystems
  • Topology
  • Protocols
  • Settings
  • Diagnostics
  • Admin
  • Analytics
  • Tasks
  • Snapshot Locators
  • Download Usage Report and Analytics
  1. Monitor the WEKA Cluster
  2. WEKA Home - The WEKA support cloud

Explore cluster insights

PreviousDeploy Local WEKA Home v2.xNextExplore performance statistics in Grafana

Last updated 2 months ago

Clusters

View clusters list

The Local WEKA Home interface provides comprehensive multi-cluster monitoring across your WEKA environment. The initial dashboard displays all registered WEKA clusters that report telemetry data to your Local WEKA Home instance.

To view the cluster overview, select it from the list, or select the 3-dot icon on the right and select Open in new tab.

Clusters graphs view

Toggle between List and Graph views using the Graphs View selector. The Graph view presents analytical visualizations of cluster distribution by version, protocol usage, installation location, network link layer (IPv4/IPv6), OBS bucket type, and reporting status (WEKA Home-connected vs. dark site installations).

Filter clusters list

You can filter and sort the clusters based on a range of criteria, including their last seen status, licensed or unlicensed status, and whether the clusters have silenced alerts.

For more advanced filtering options, select the Advanced filters icon.

Download clusters report

To download a report of all your clusters, select the Download icon.

Overview

The Overview page provides a consolidated dashboard of critical cluster-wide metrics and operational status. This interface displays multiple monitoring panels that facilitate rapid assessment of cluster health, configuration parameters, active alerts, system events, and performance metrics.

Navigation

Access specialized view pages by either:

  • Selecting the corresponding option in the left navigation menu.

  • Clicking directly on panel titles within the Overview dashboard.

Panel functionality

Each panel in the Overview dashboard serves as both a summary display and an entry point to more detailed information:

Alerts panel

The Alerts panel displays severity-categorized cluster alerts with interactive drill-down capabilities. Click any alert to access complete diagnostic details including severity classification, timestamp, condition description, and prescribed remediation steps.

Hardware Panel (example of drill-down functionality)

The Hardware panel provides visibility into physical and logical cluster components through the Backends and Clients tabs, displaying servers, containers, processes, drives, OBS, and link layer with relevant operational metrics. Each component supports drill-down functionality for detailed diagnostics.

Additional panels provide similar drill-down functionality for their respective domains, following the same interaction pattern demonstrated in the Alerts and Hardware panels.

Events

The Events page displays the offline event data for the cluster and associated detail with each event. You can use filters to refine your search according the event severity, category, process ID, and more.

Filesystems

The Filesystems page provides comprehensive information about the configured filesystems in the cluster.

You have the flexibility to reorganize the display by selecting any column in the tables, and you can use filters to refine your search. For more in-depth information in JSON format, select a specific row.

Topology

The Topology page presents an array of cluster configurations categorized into sections: Servers, Containers, Processes, Drives, and Network Devices.

You have the flexibility to reorganize the display by selecting on any column in the tables, and you can use filters to refine your search. For more in-depth information in JSON format, select a specific row.

Select each tab to explore the topology screens.

Protocols

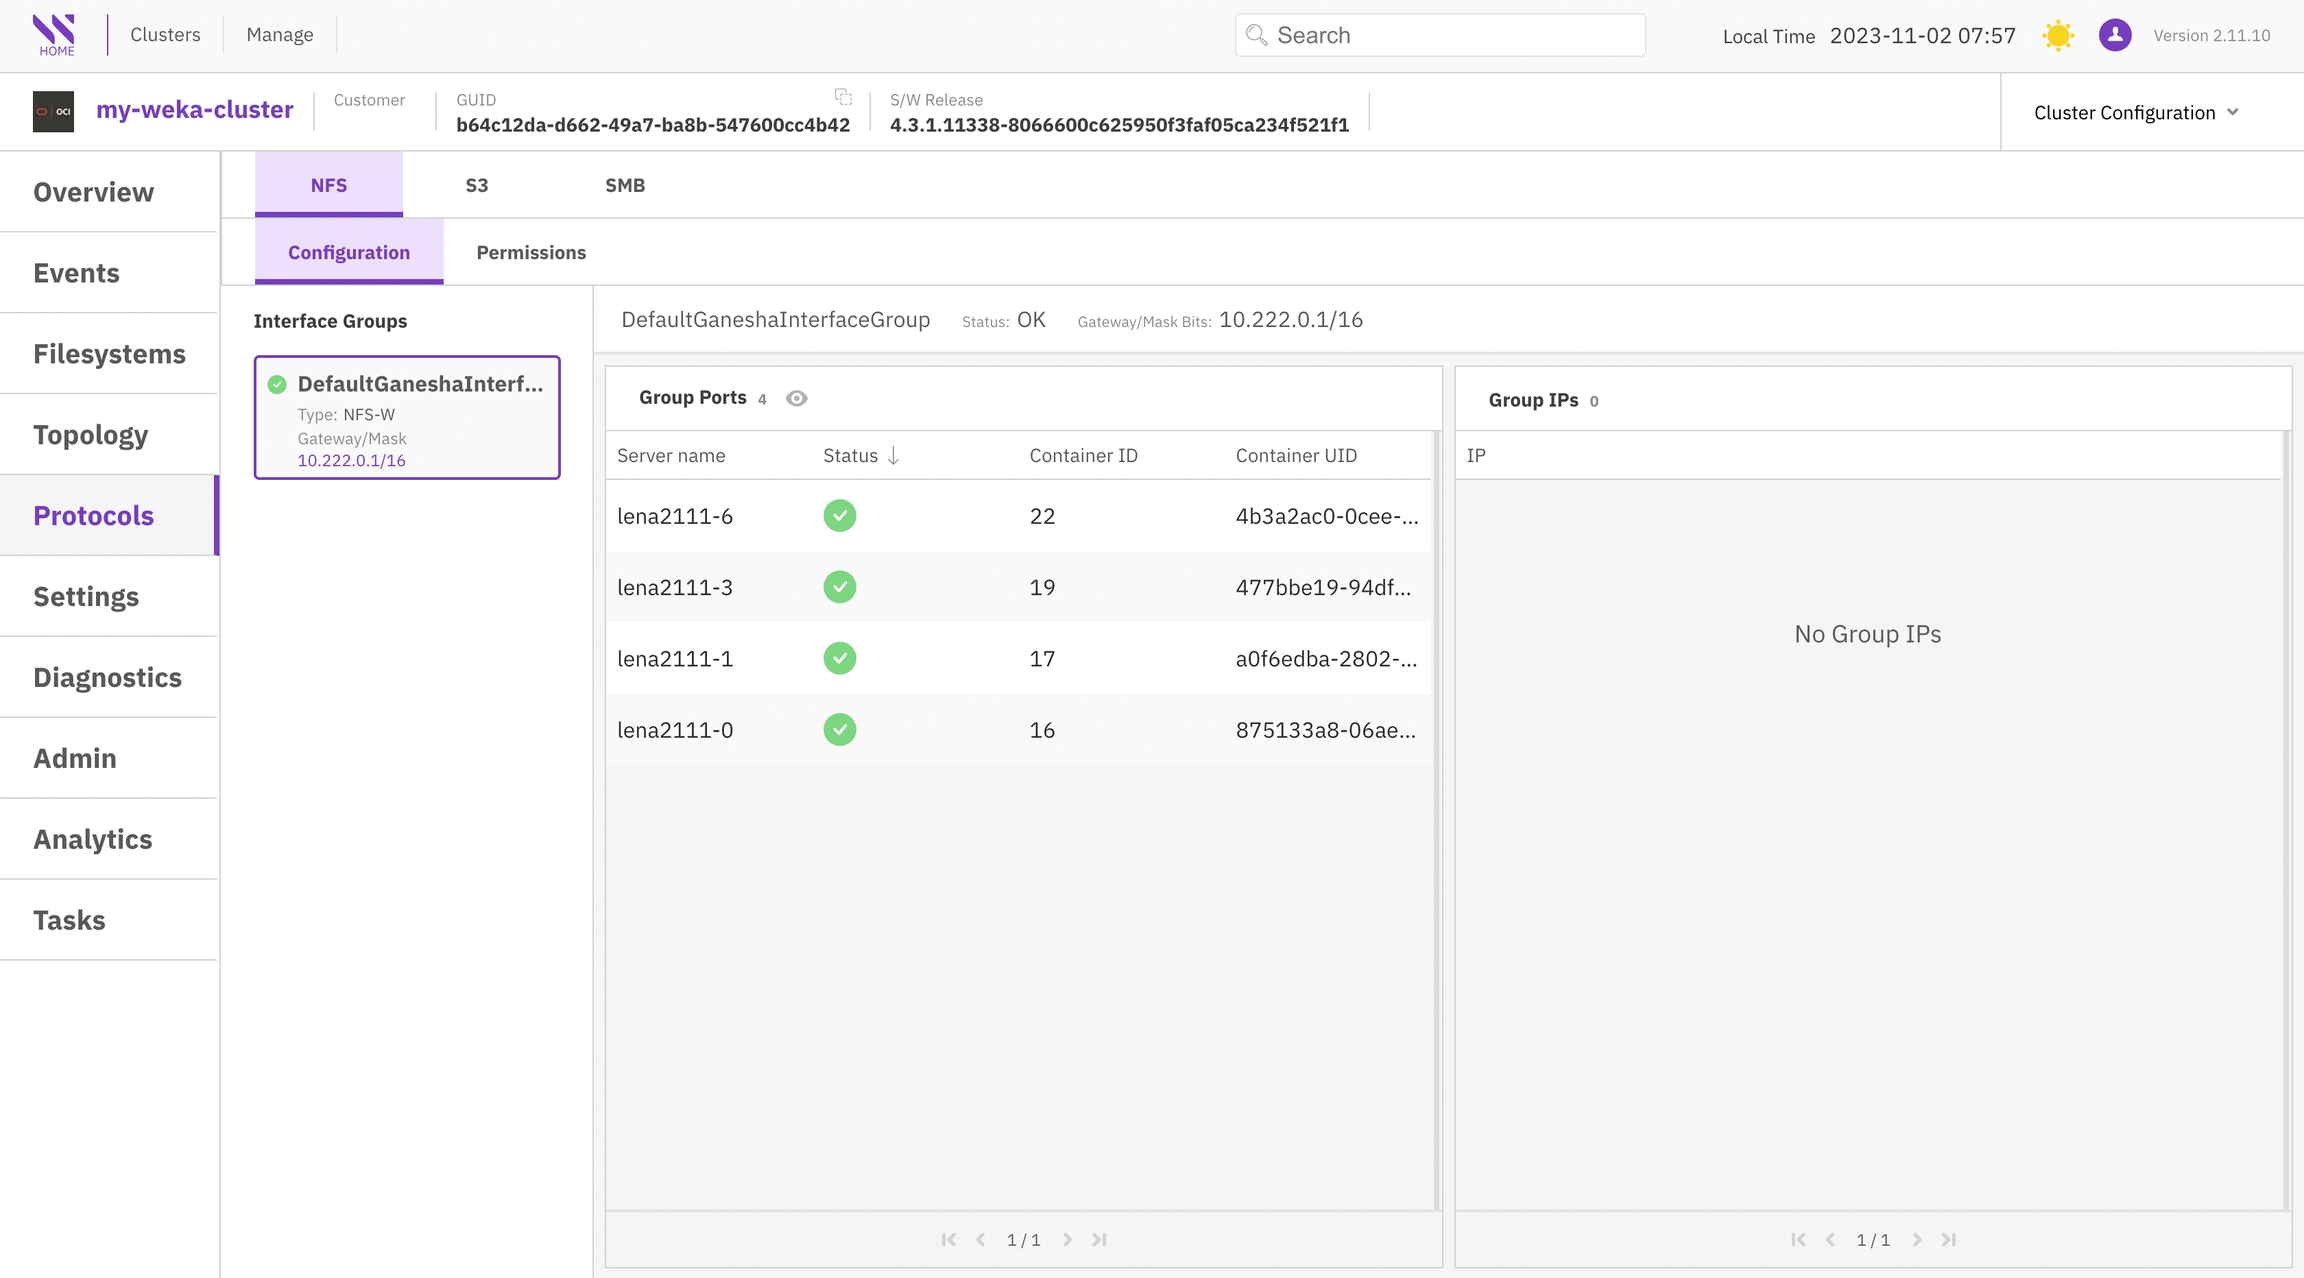
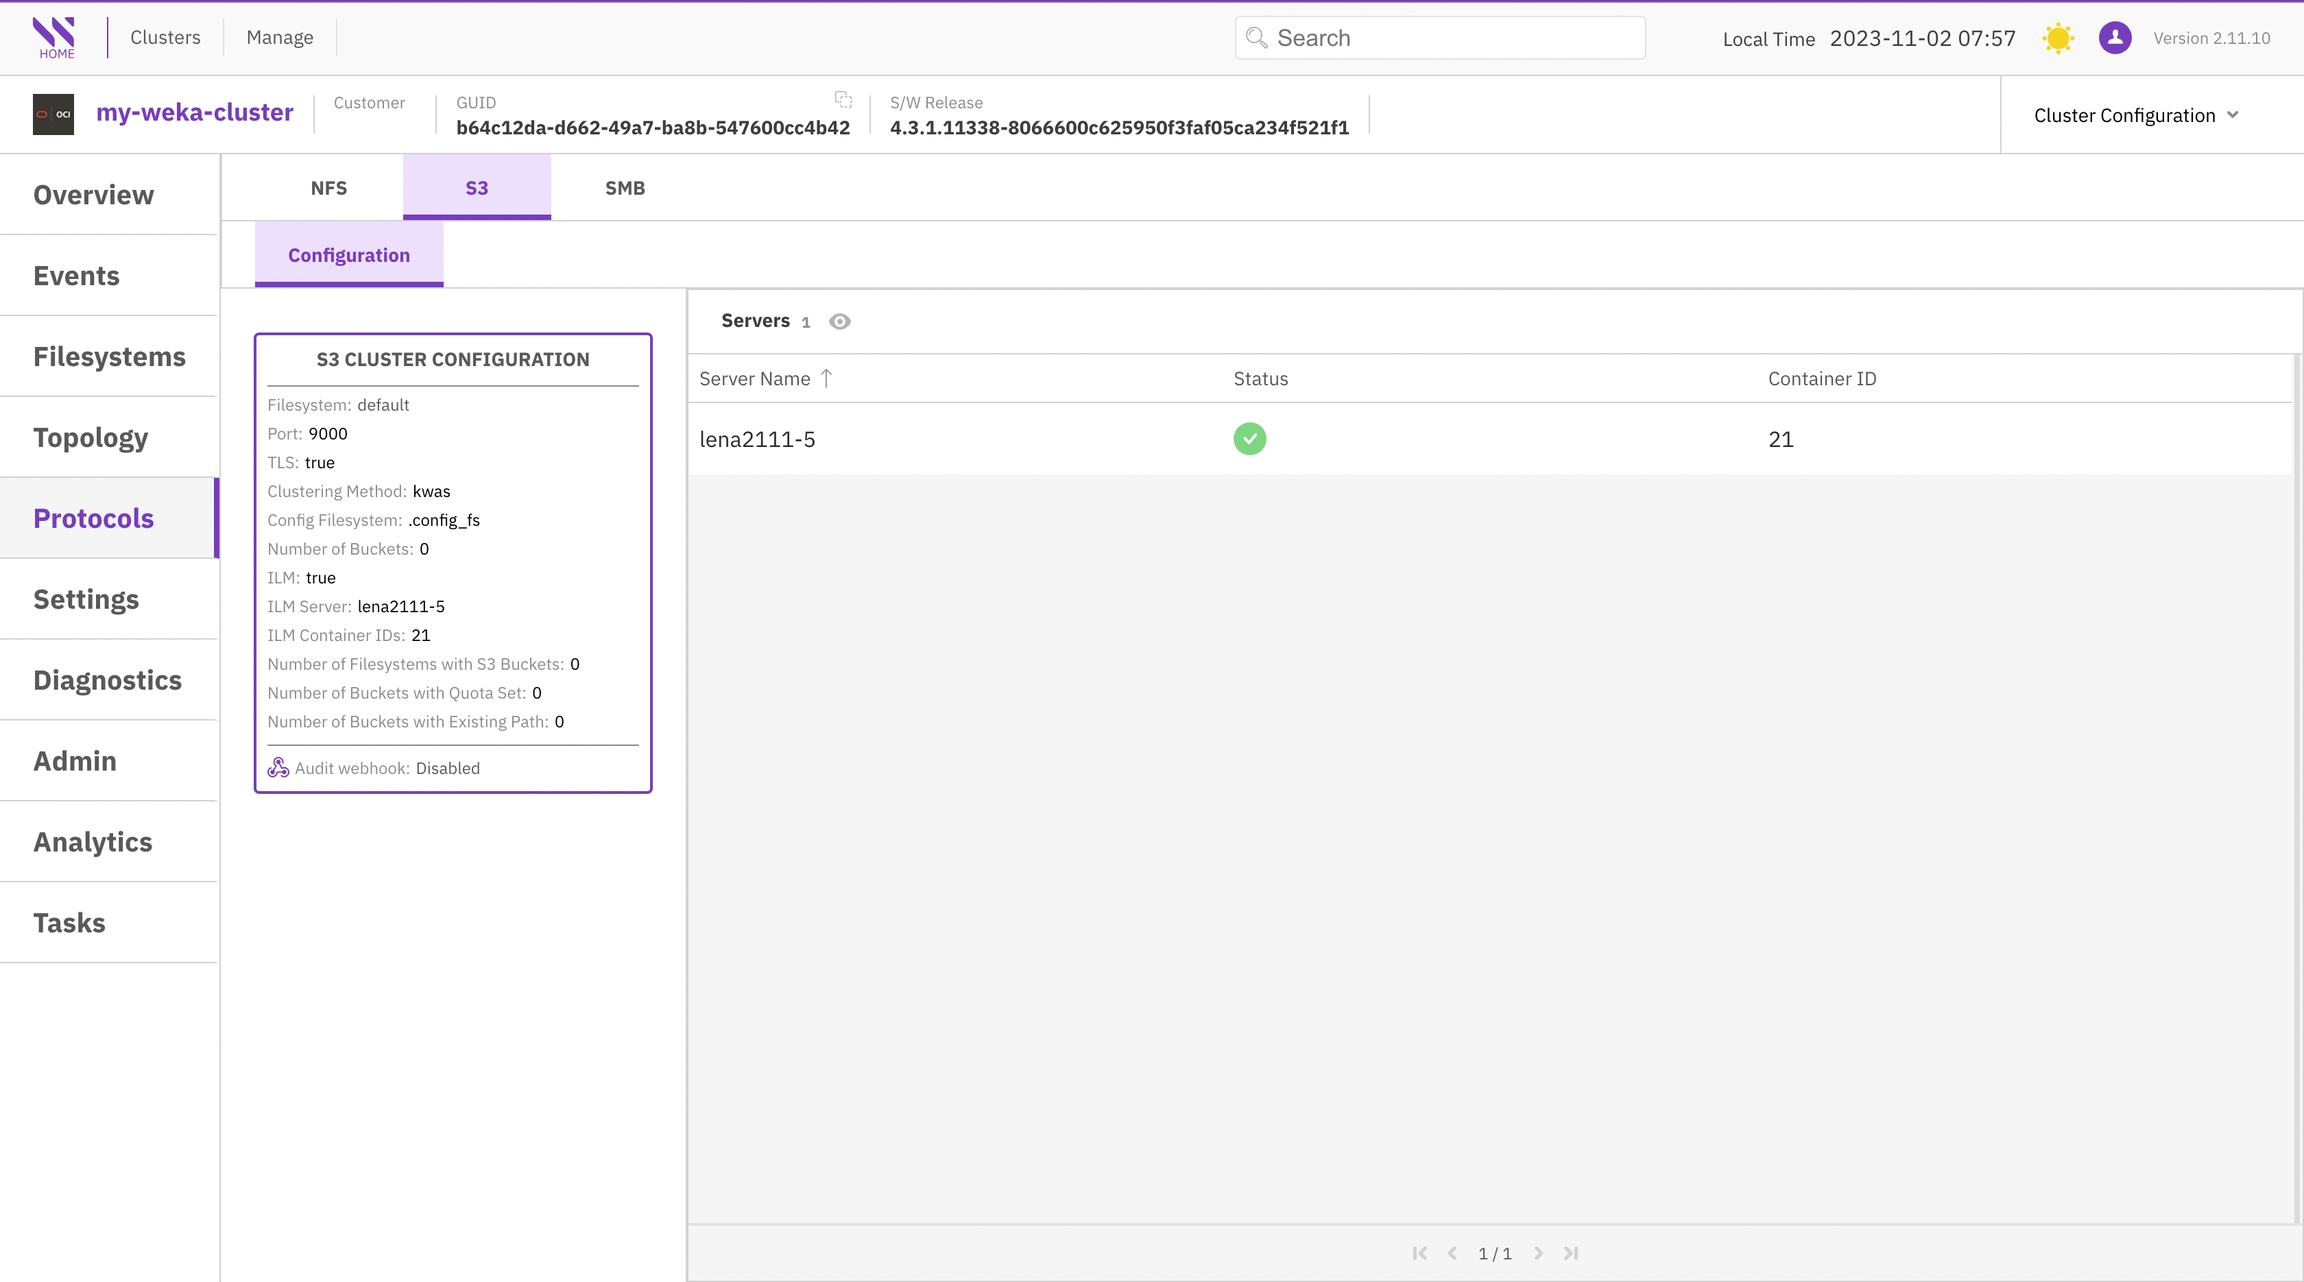
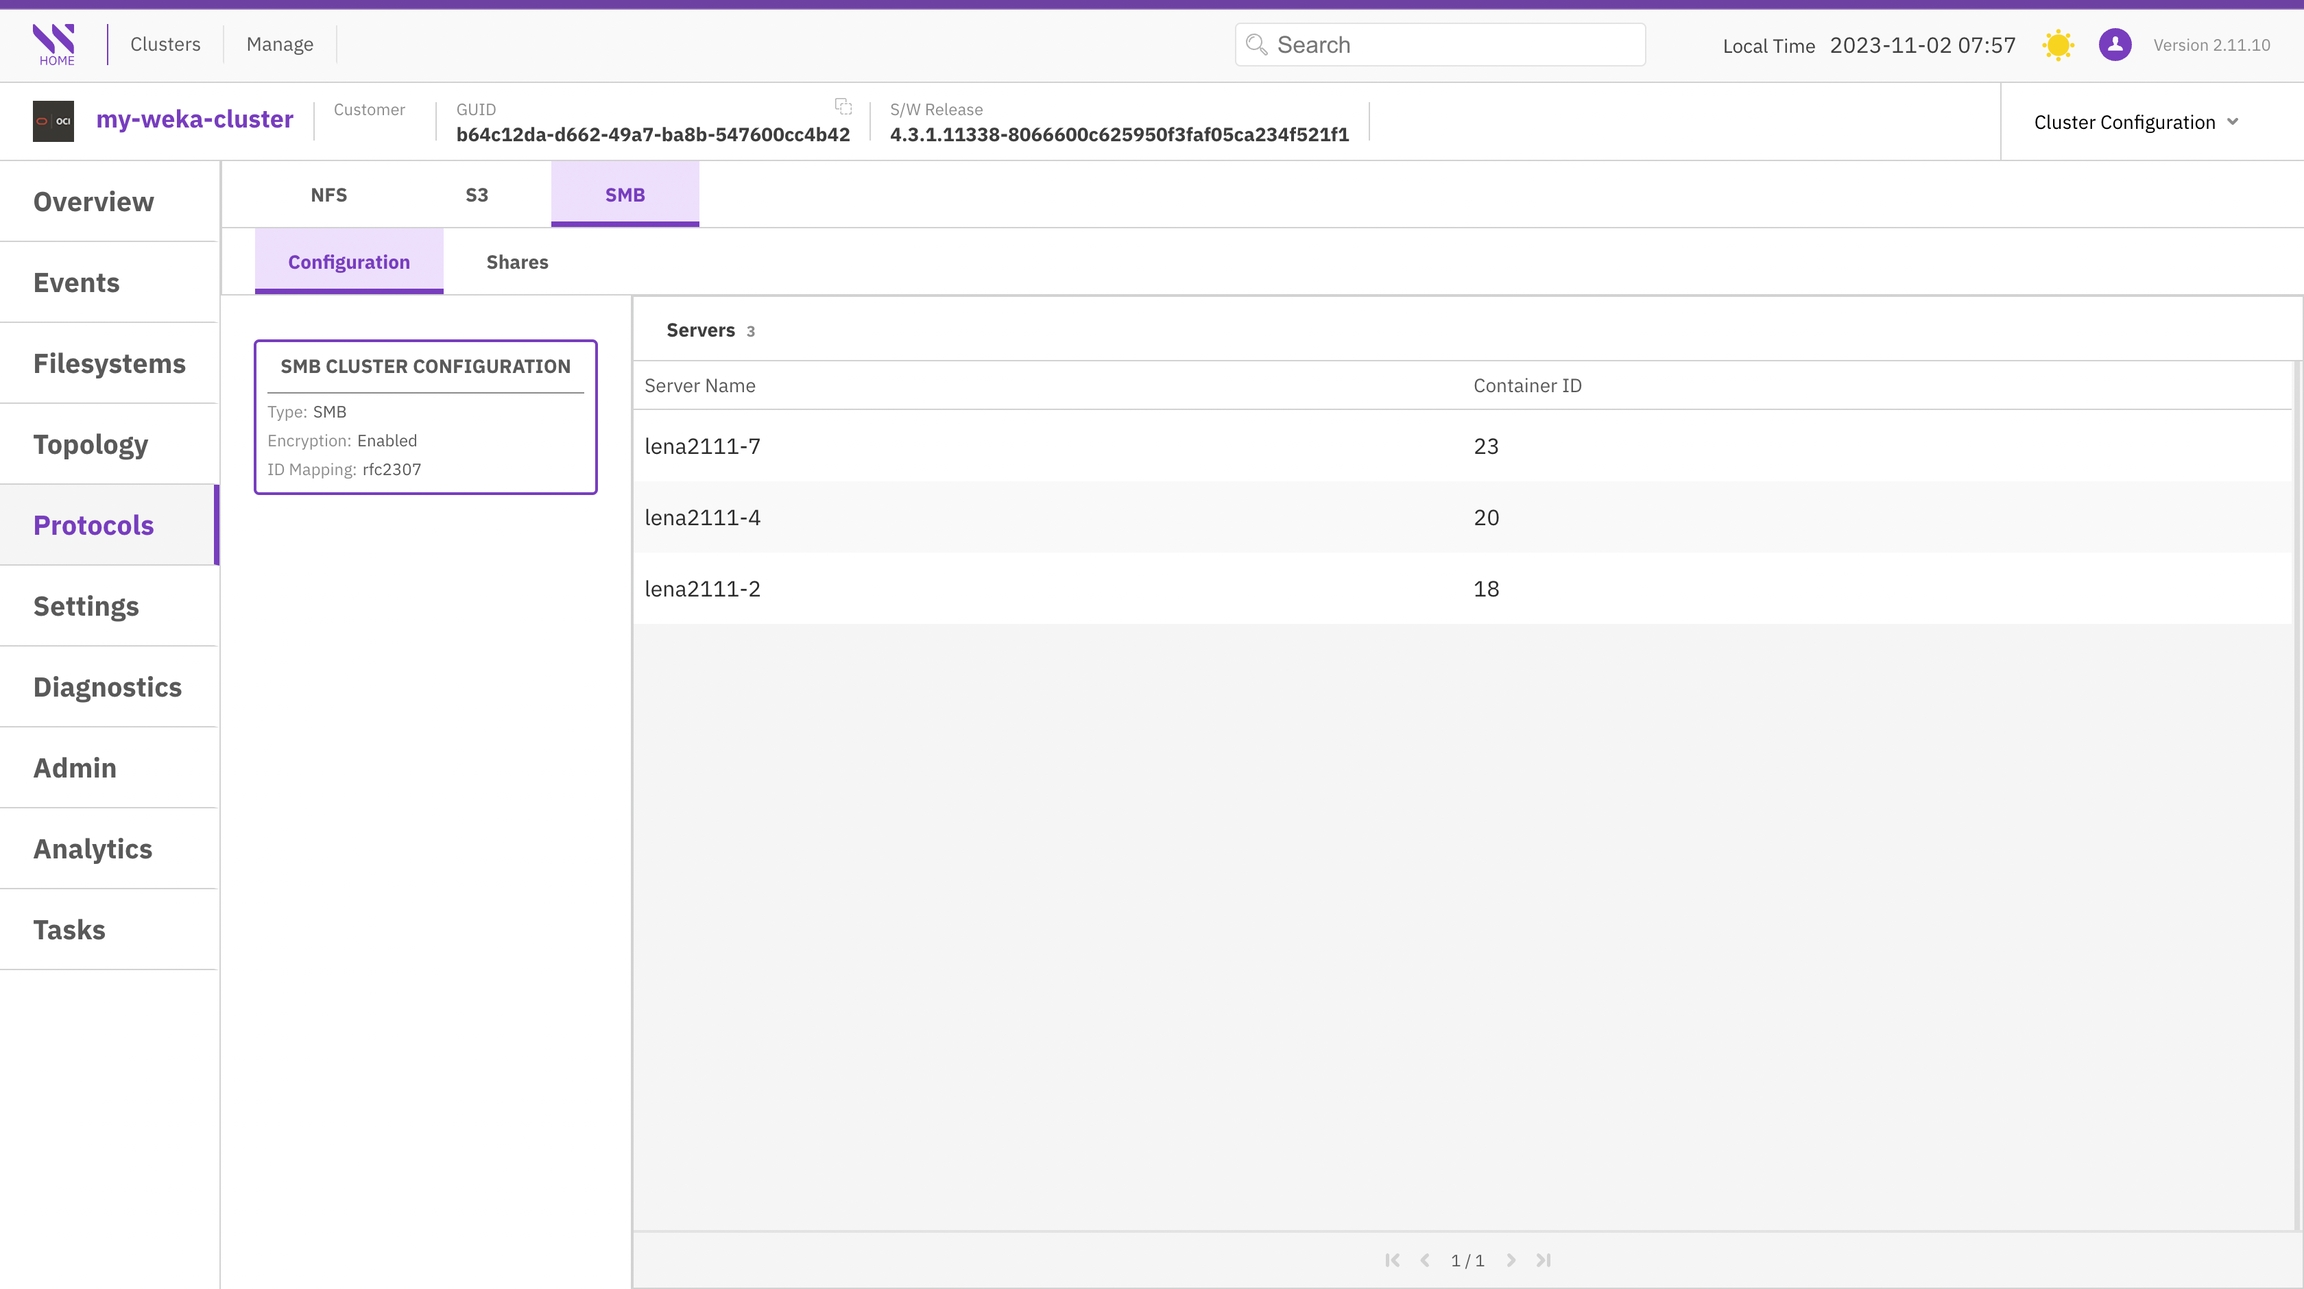
The Protocols page provides comprehensive information about the configured protocols in the cluster. Each tab corresponds to a specific protocol, including NFS, S3, and SMB.

You can customize the display order of information in the tables by selecting the column title.

Select each tab to explore the protocol screens.

Settings

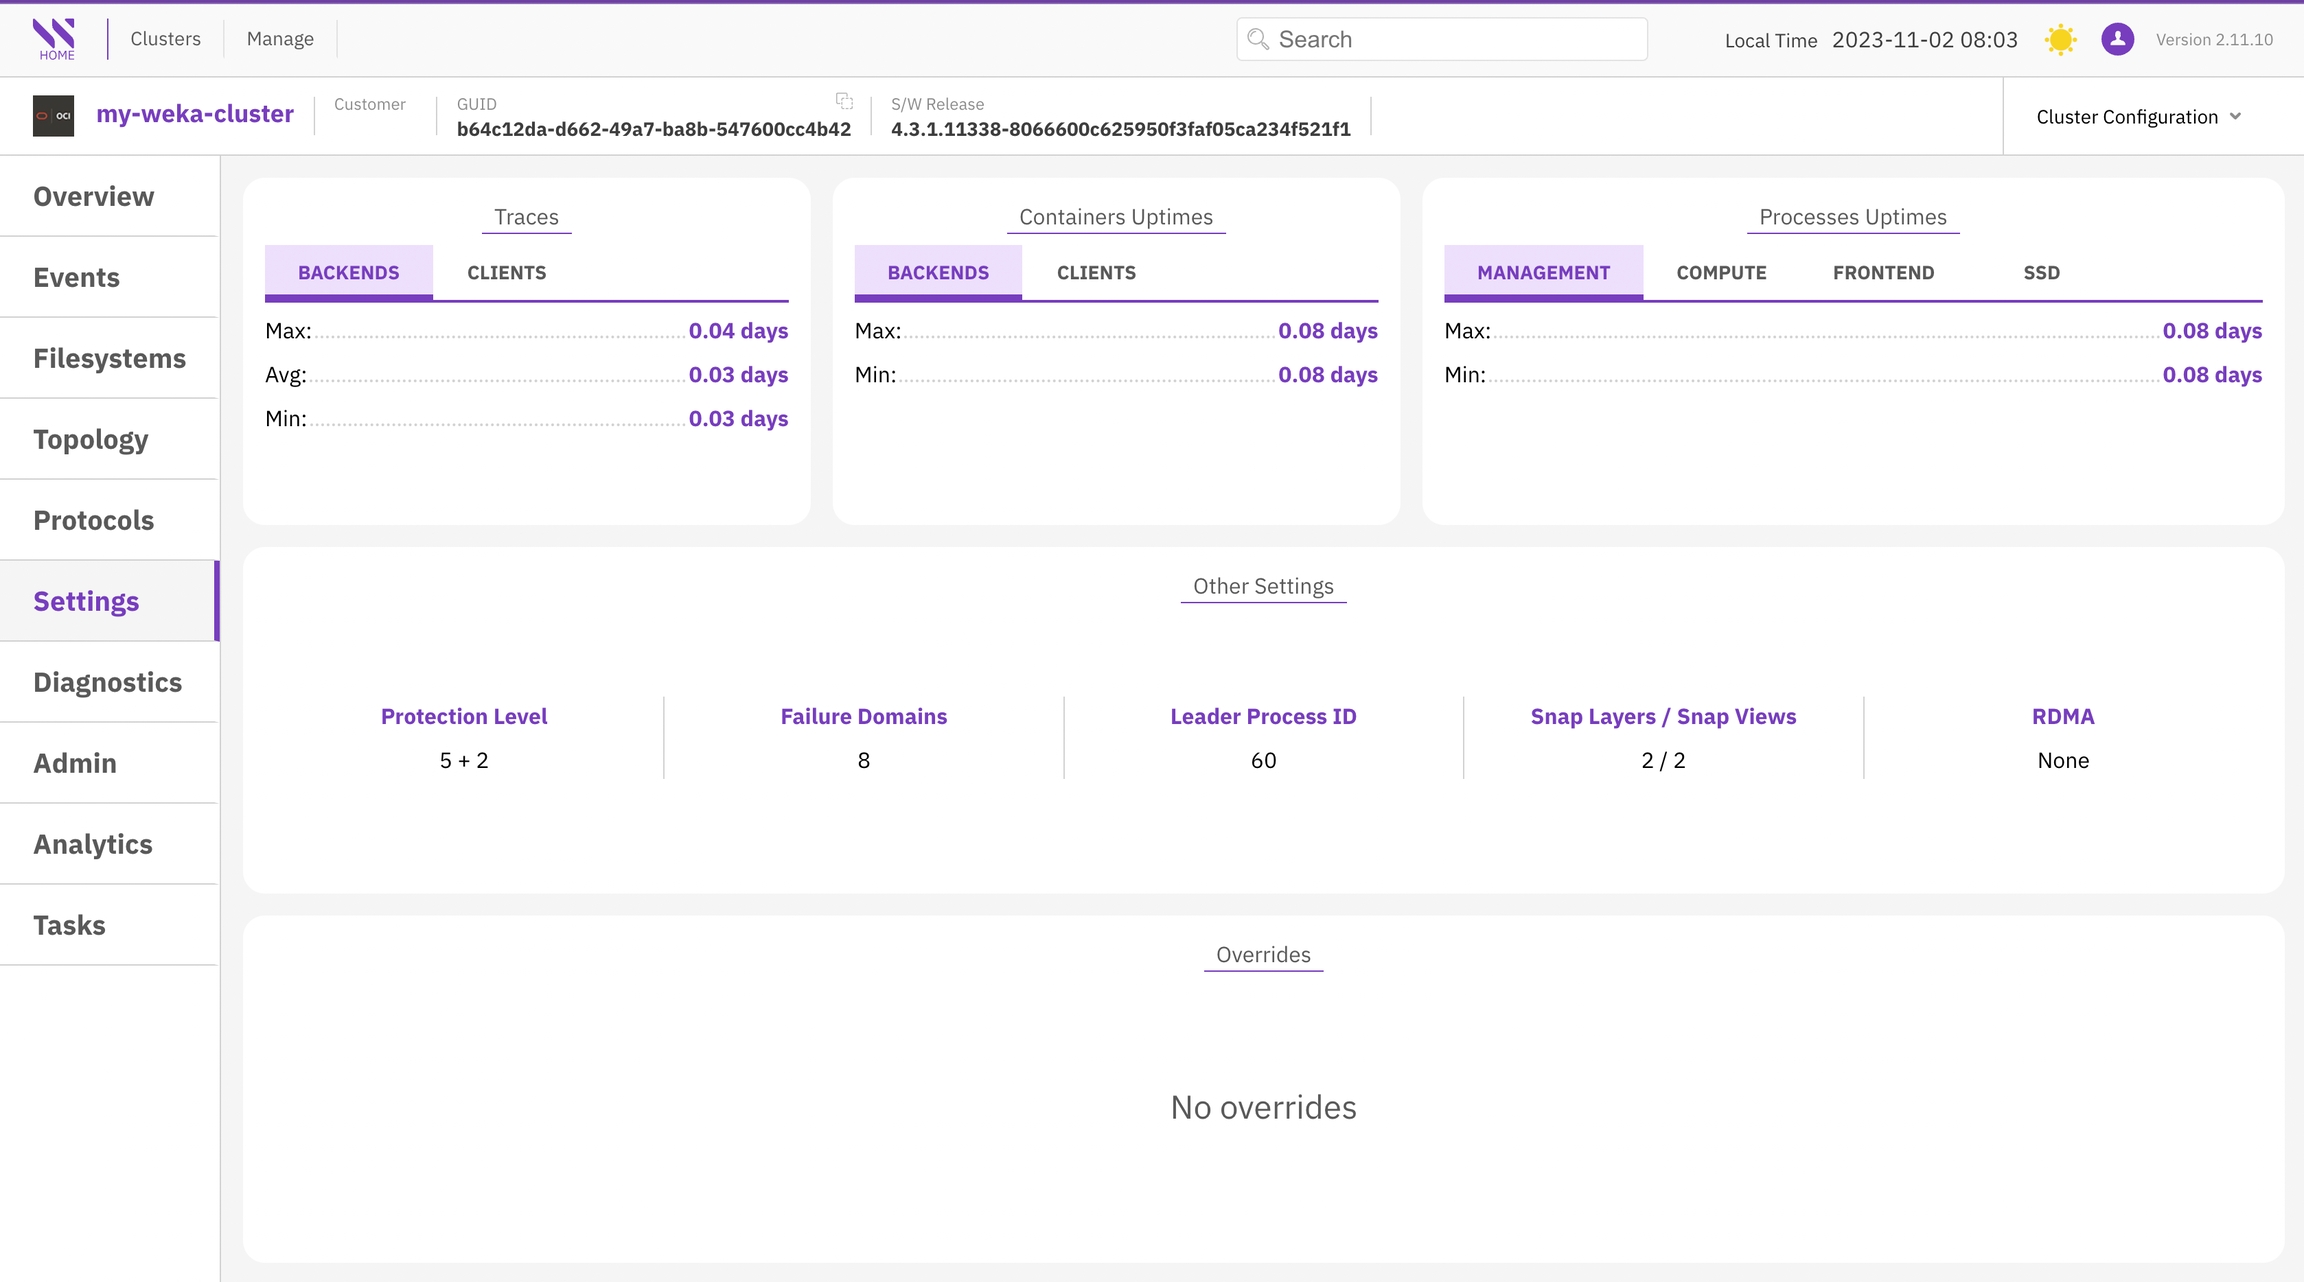
The Settings page displays a variety of panels containing information such as traces, container uptimes, process uptimes, overrides, and more.

Diagnostics

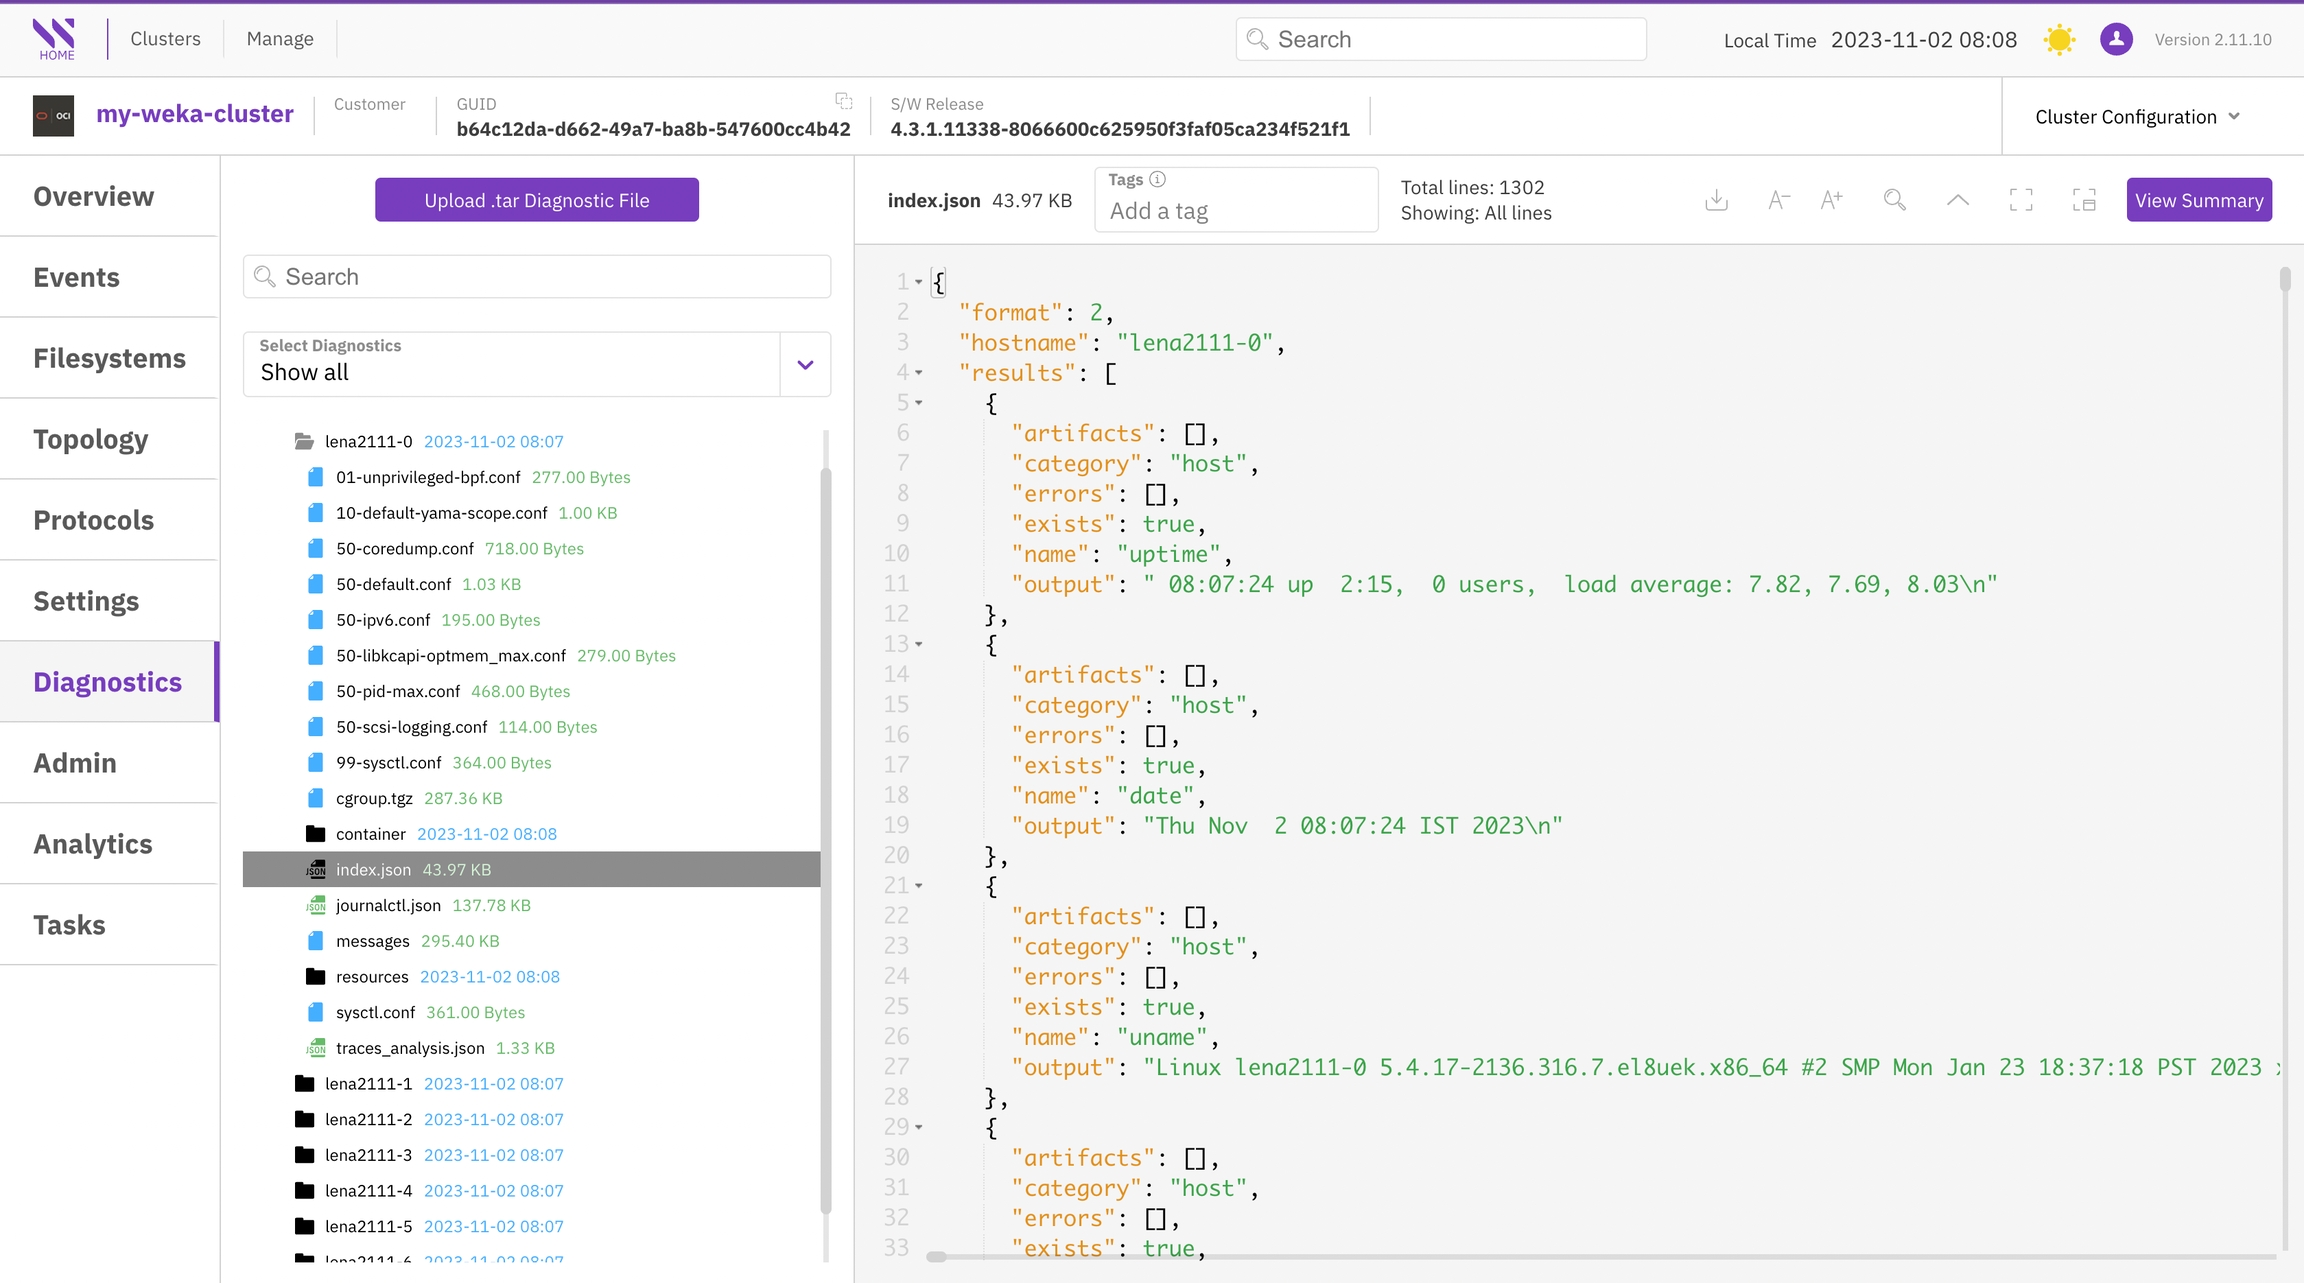
The Diagnostics page displays the content of all diagnostic files uploaded from the cluster. Diagnostics are neatly organized in a file system tree structure for convenient navigation.

To access the file content, select the respective file.

Additionally, you have the option to directly upload a diagnostics tar file. You can effortlessly locate specific information by using the search feature and its additional options.

Admin

See Enforce security and compliance.

Analytics

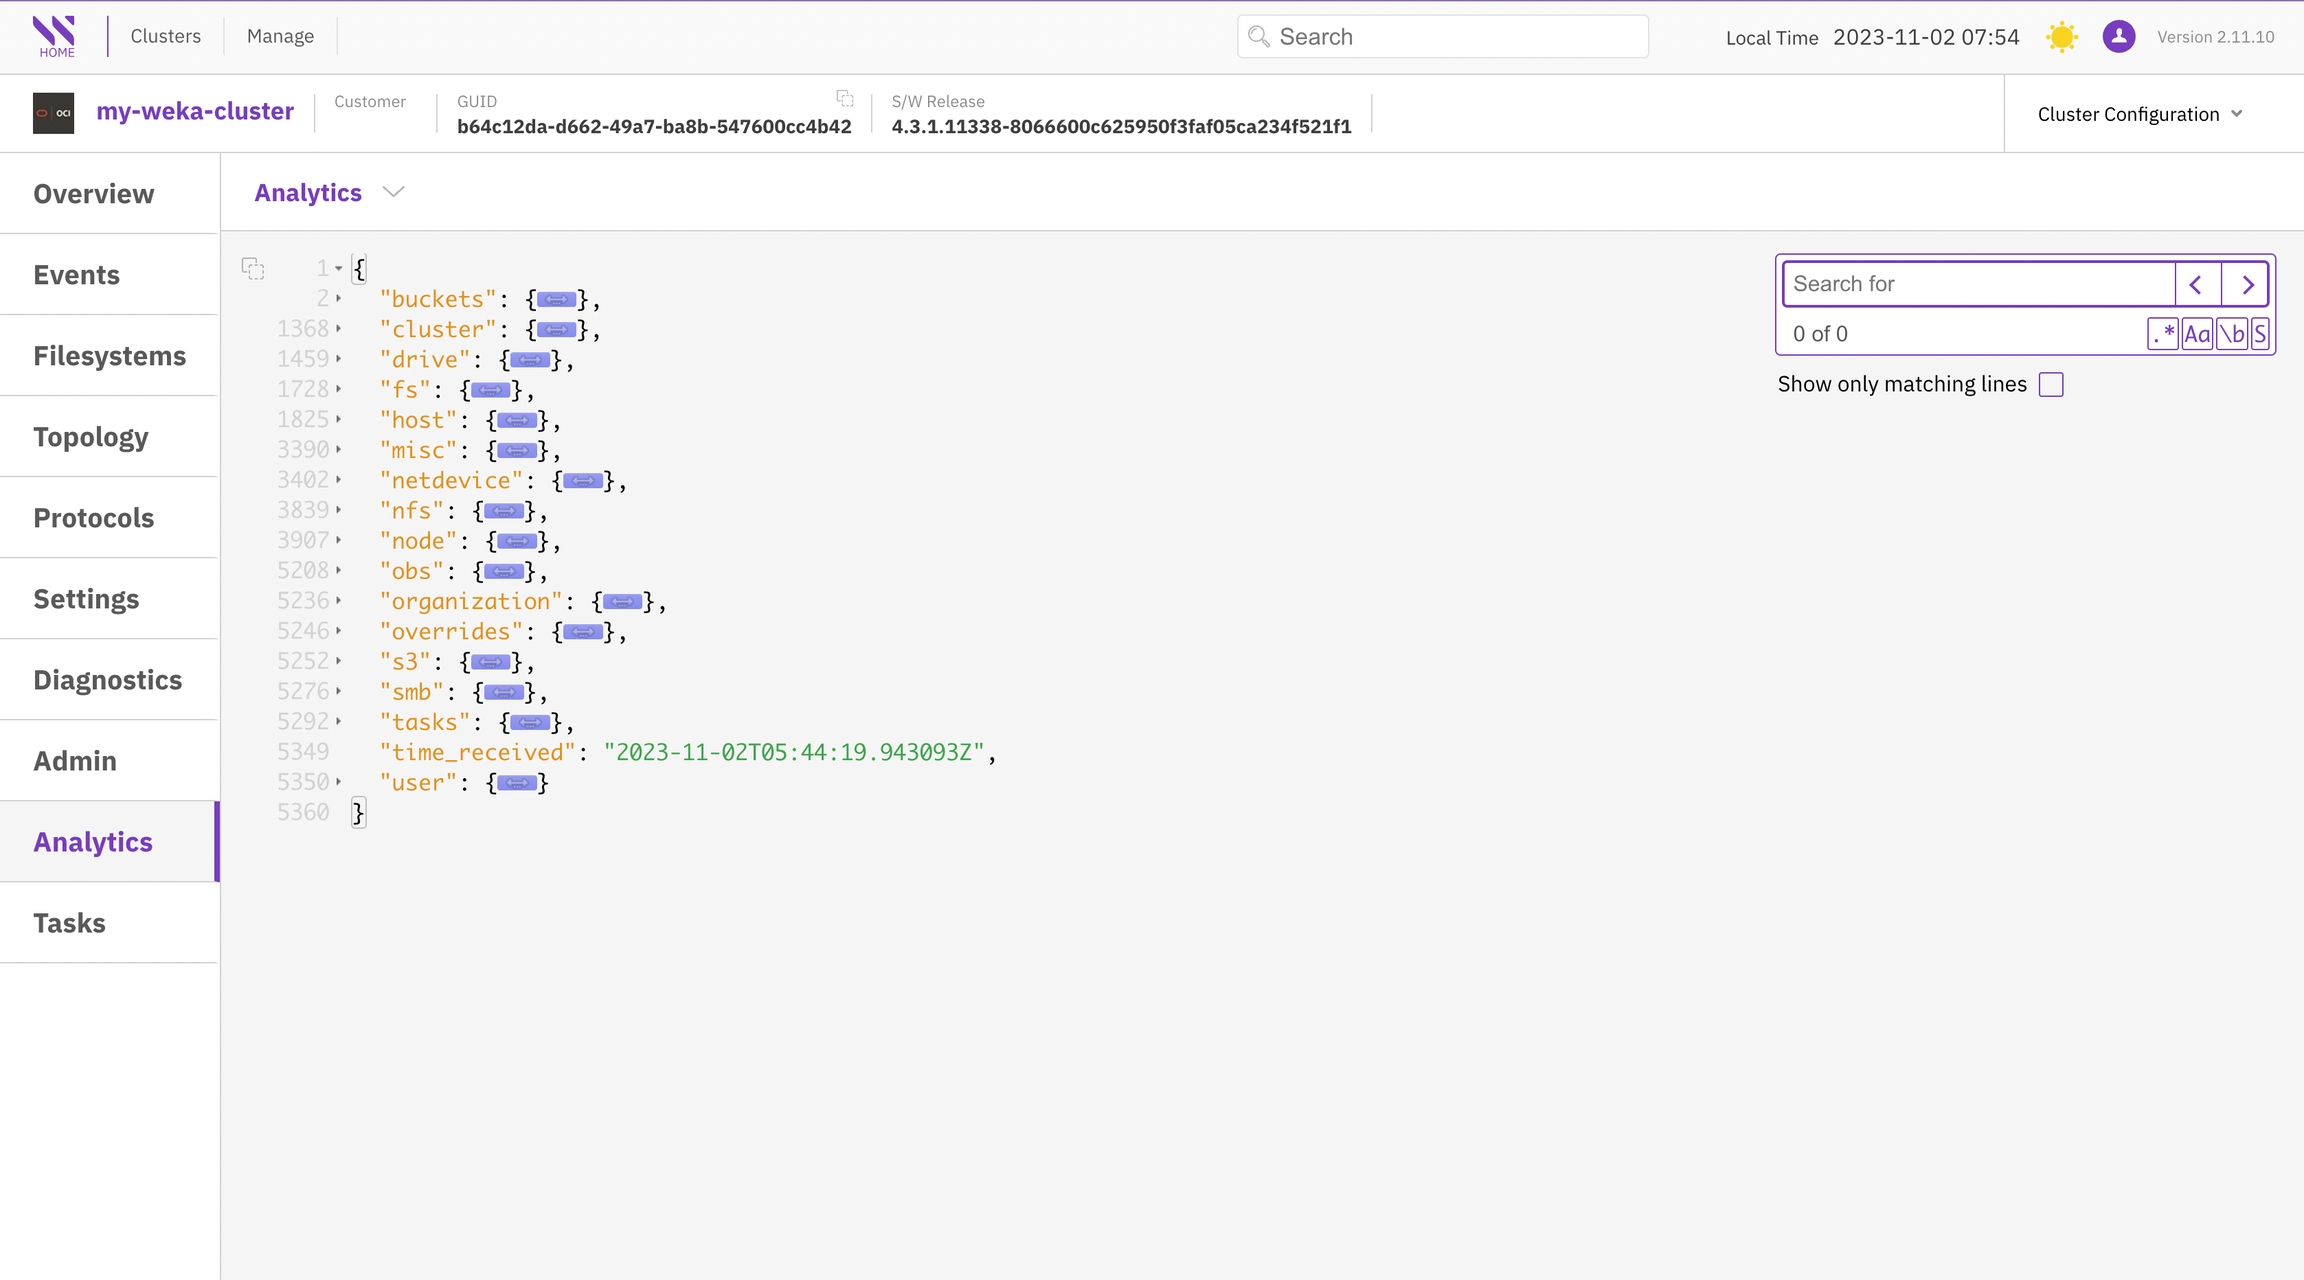
The Analytics page displays the cluster configuration (similar to the Topology view) in JSON format. To locate specific information, use the search feature and its options. If you need to copy the content, click the copy icon located next to the first row.

Tasks

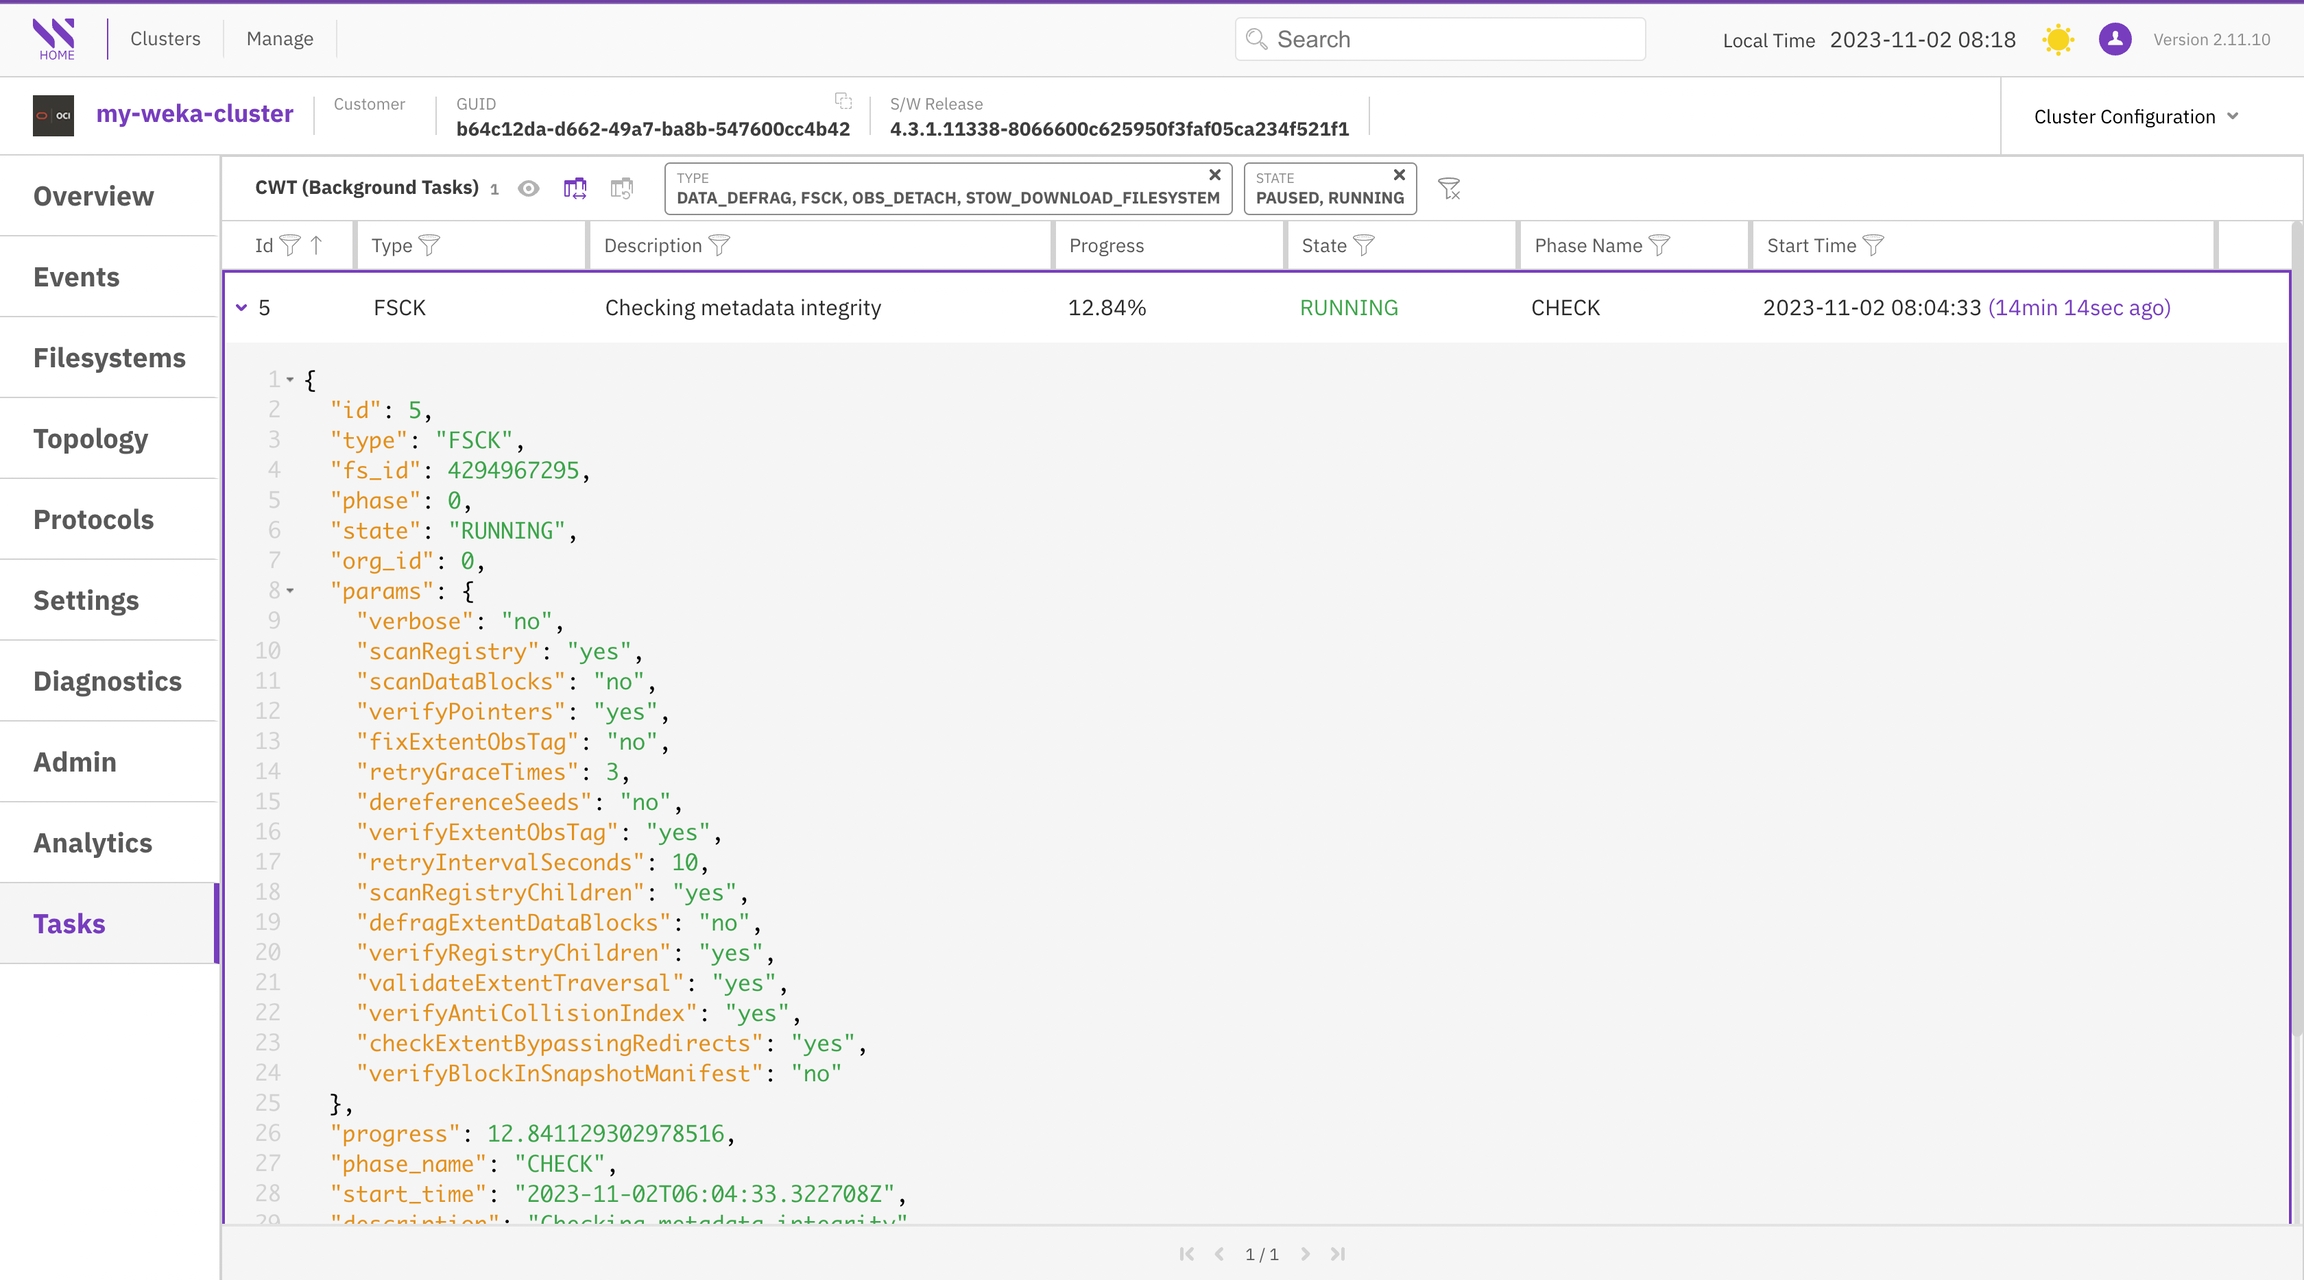
The Tasks page presents a list of background tasks with various statuses that are currently active in your cluster.

You can further refine your task list and customize the display order of information in the tables by selecting the column title.

To access detailed information about a specific task, select its row to view it in JSON format.

Snapshot Locators

The Snapshot Locators page displays a list of snapshot locators, which serve as unique references to snapshots stored in an object store. These locators are essential for restoring filesystems, managing snapshots, and recovering data. Each locator enables the system to access and manipulate the corresponding snapshot data.

The page presents the following details in a table format for each locator:

  • Locator: The unique identifier of the snapshot in the object store.

  • Snapshot: The name or ID of the associated snapshot.

  • Filesystem: The filesystem from which the snapshot was created.

  • OBS Site: The object store site where the snapshot is stored.

  • Event Time: The timestamp of when the snapshot was created or modified.

Download Usage Report and Analytics

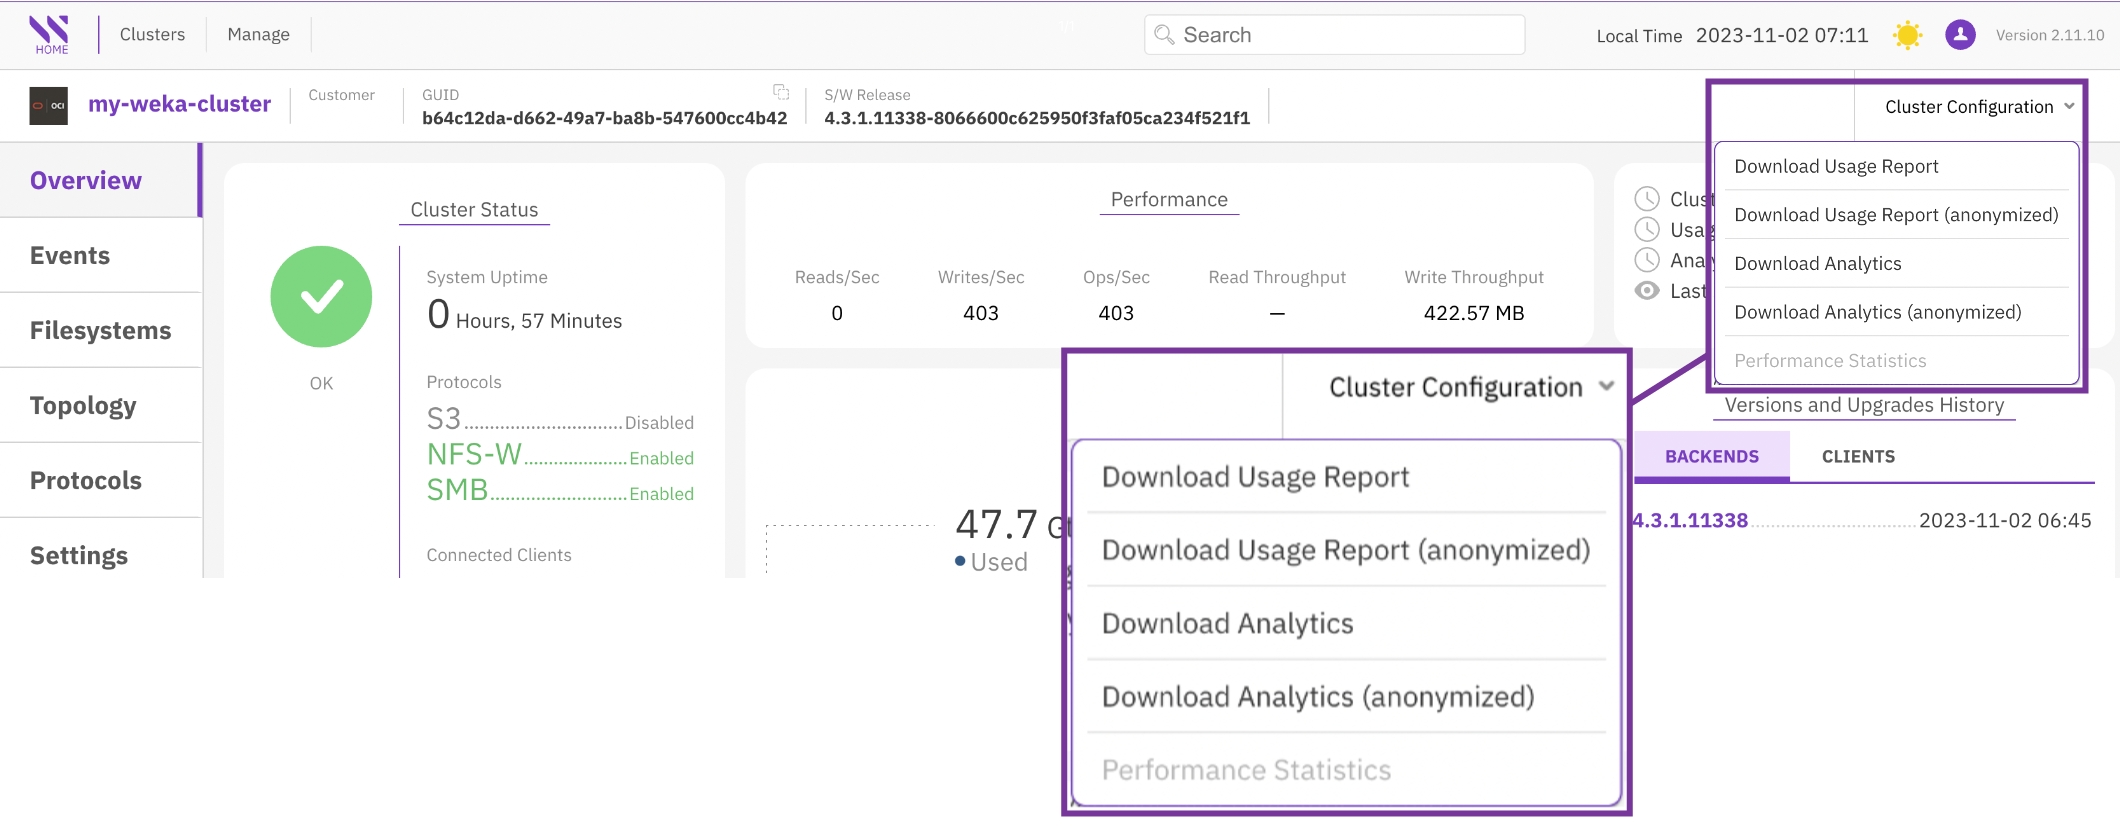
Local Weka Home allows you to download JSON-formatted reports to your local workstation for viewing and forwarding to the Customer Success Team for case resolution. You can also add these reports to Cloud Weka Home for offline monitoring.

If your data includes sensitive values that you want to protect, you can choose to download anonymized reports. In anonymized reports, sensitive values are handled as follows: The cluster name is replaced with weka-[first part of cluster GUID] and other sensitive values are removed.

Usage Report default anonymized data

The following properties are affected by anonymization:

  • name

  • alerts

  • status/name

  • status/cloud

Analytics default anonymized data

The following properties are affected by anonymization:

  • cluster/name

  • For all hosts:

    • host/hosts/ips

    • host/hosts/host_ip

    • host/hosts/hostname

    • host/hosts/instance_region

    • host/hosts/aws_instance_region

  • misc/kms/type

  • misc/cloud/url

  • nfs/interface_groups/name

  • nfs/interface_groups/gateway

  • nfs/interface_groups/subnet_mask

  • s3/domain

  • s3/filesystem

  • smb/smb_trusted_domains

The anonymization option is supported with WEKA clusters of version 3.14.2 and above.

Clusters page
Clusters graphs view
Clusters page: Advance filters
Download clusters report
Cluster overview
Panel functionality
Events page
Filesystems view with in-depth information in JSON format
Setting page
Diagnostics view
Analytics view
Tasks view
Snapshot Locators
Download Usage Report and Analytics