Set up the WEKAmon external monitoring

The WEKAmon is an external monitoring package that provides enriched monitoring capabilities using the Grafana and Prometheus tools.

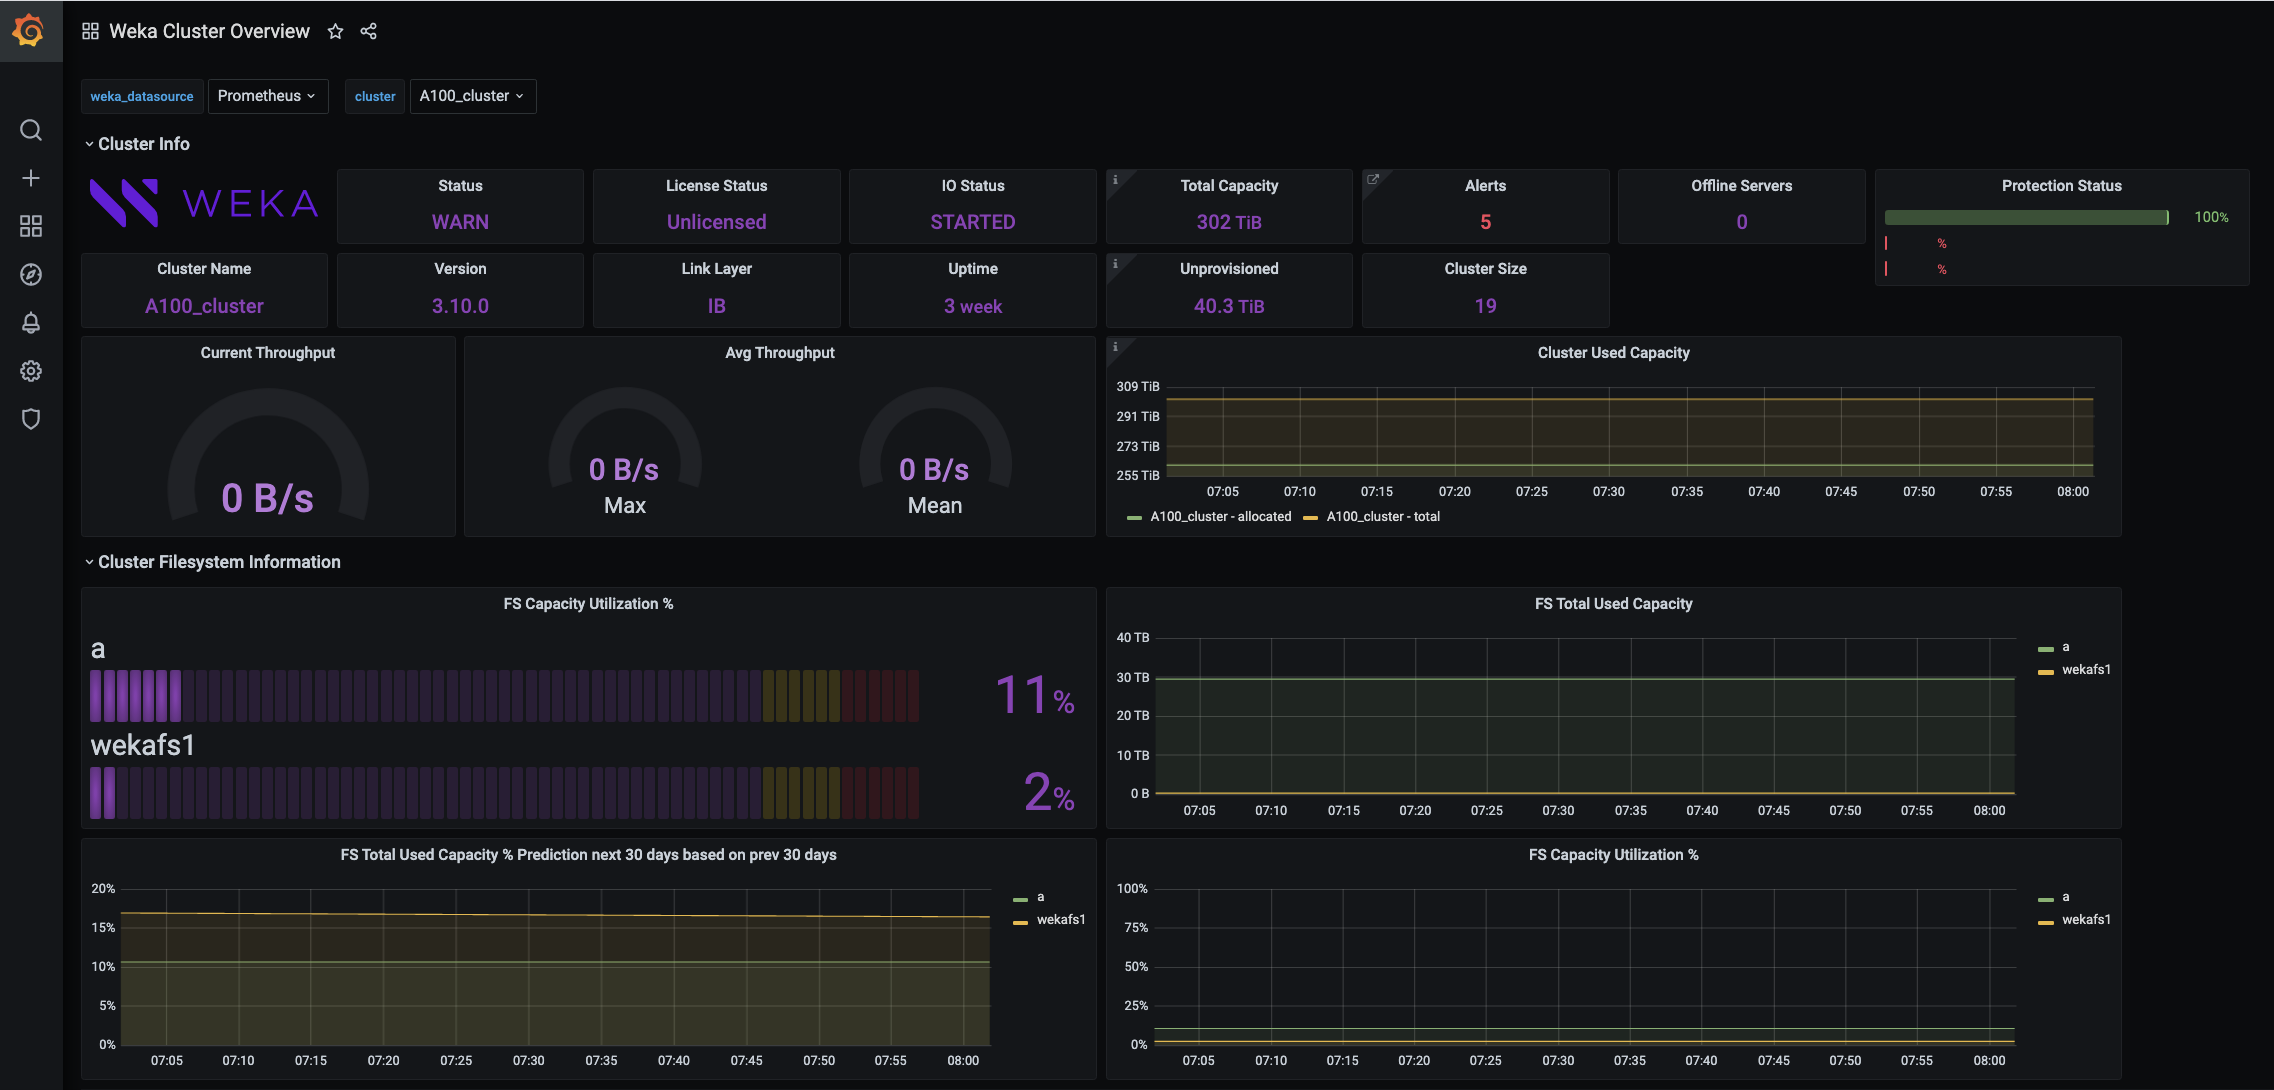
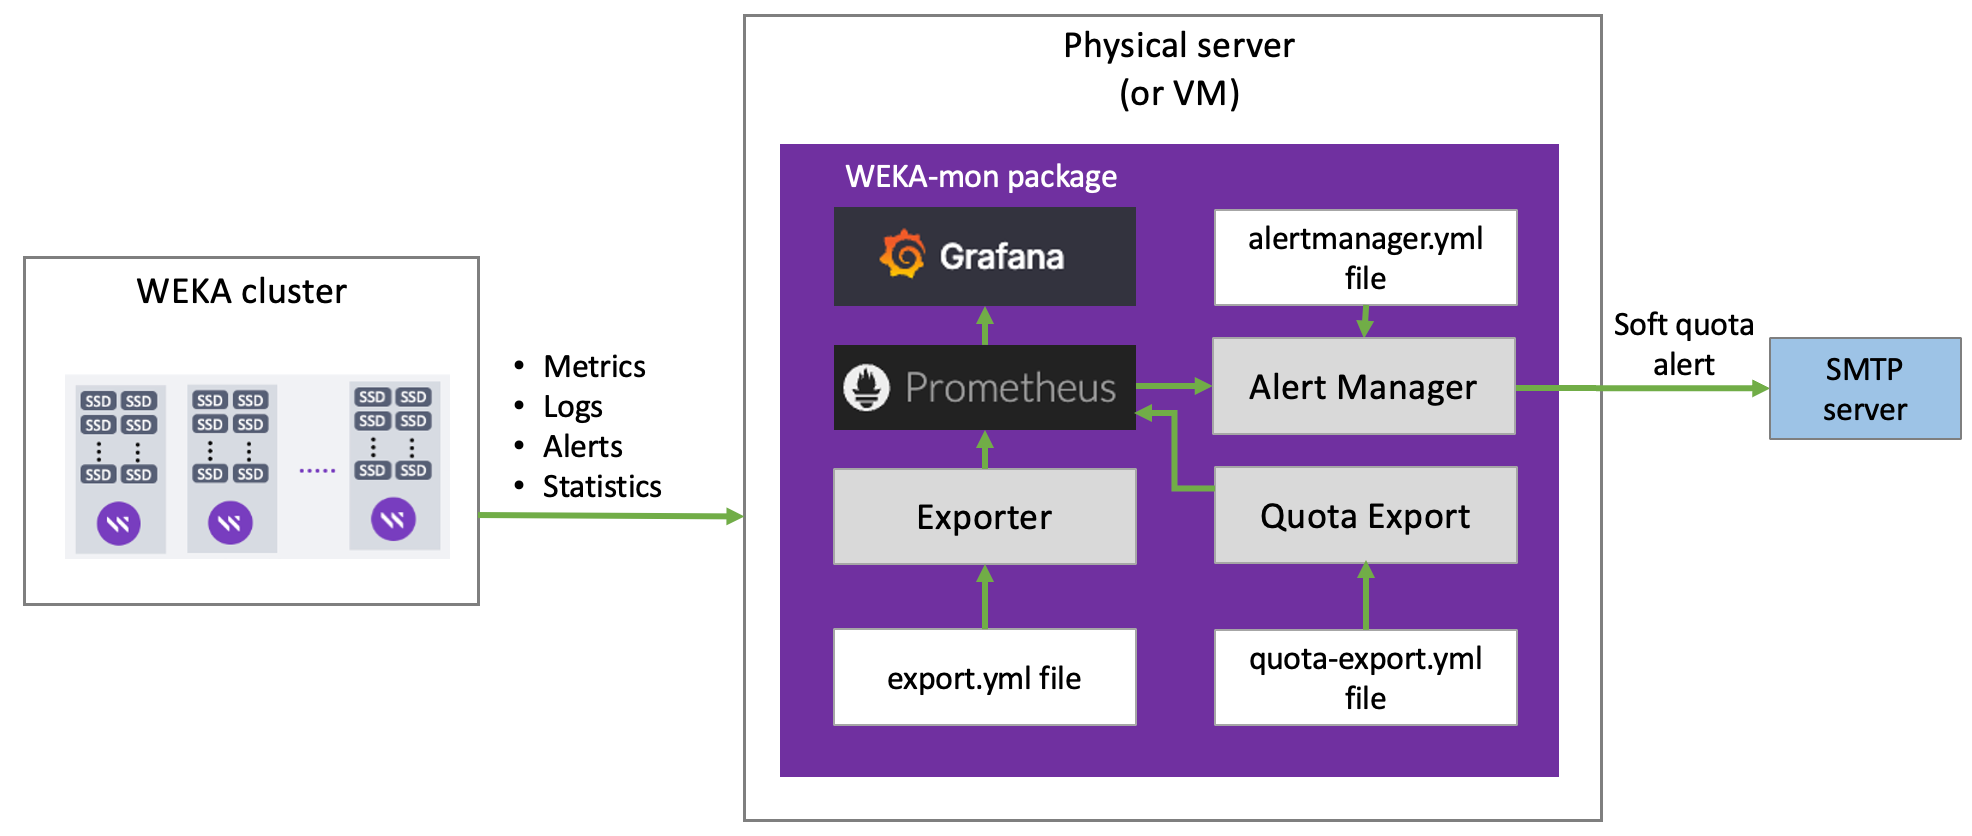
WEKA provides an external monitoring package named WEKAmon. The package implements the well-known Grafana dashboard with Prometheus, which provides a central monitoring dashboard of metrics, logs, alerts, and statistics with enriched capabilities.

The package also includes the following components:

  • Exporter: The Exporter gets the data from the WEKA cluster and sends the data to Prometheus.

  • Quota Export: The Quota Export manages the quotas and sends the data to Prometheus.

  • Alert Manager: The Alert Manger alerts users through an SMTP server when they reach their soft quota limits.

You can set up the WEKAmon package regardless of the data monitoring provided by the Weka GUI.

One of the advantages of setting up the WEKAmon package is that if you already use the Grafana and Prometheus tools for monitoring other products, you can integrate these tools with WEKA to correlate and display monitoring information from all your products on the same dashboard.

If you have deployed the WMS, follow the procedure in:Deploy monitoring tools using the WEKA Management Station (WMS). Otherwise, continue with this workflow.

Before you begin

Setting up a dedicated physical server (or VM) for the installation is recommended.

Server minimum requirements

  • 4 cores

  • 16 GB RAM

  • 50 GB / partition (for the root)

  • 50 GB /opt/ partition (for WEKAmon installation)

  • 1 Gbps network

  • Docker is the recommended container for the WEKAmon setup. To use Docker, the following must be installed on the dedicated physical server (or VM):

    • docker-ce

    • docker-compose or docker-compose-plugin, depending on the existing operating system.

    For instructions on the Docker installation, see the Docker website.

WEKAmon authentication

For the WEKAmon host to communicate with the WEKA cluster, a security token is necessary. However, the WEKAmon host is not required to have the WEKA client installed.

Prepare WEKAmon user and token

Perform the following steps on an existing host with access to the WEKA CLI, for example, on a WEKA backend server.

  1. Create a dedicated user: Create a unique local username (for example, wekamon) for WEKAmon. The unique username is displayed in the event logs, making the identification and troubleshooting of issues easier. Then, assign the ClusterAdmin or OrgAdmin role. Example: weka user add wekamon clusteradmin

  2. Generate an authentication token for the user: Run the following command: weka user login wekamon --path wekamon-authtoken.json

  3. Transfer the token: Copy the wekamon-authtoken.json file to the WEKAmon management server. It will later be placed in a specific directory on that host.

  4. Remove the token file: Delete the wekamon-authtoken.json locally. Example: rm wekamon-authtoken.json

Configure WEKAmon host with authentication token

Perform the following steps on the WEKAmon host.

  • Create a directory for the authentication token: Run the following command:

    mkdir /root/.weka

  • Move the previously-created authentication token into the new directory: : Run the following command: mv ~/wekamon-authtoken.json /root/.weka/auth-token.json

  • Ensure appropriate ownership and permissions are set: Run the following commands: chown root:root /root/.weka/auth-token.json chmod 400 /root/.weka/auth-token.json

Related topics

Create a local user

Obtain authentication tokens

Workflow: Install the WEKAmon package

  1. Obtain the WEKAmon package: Obtain the WEKAmon package from the GitHub repository by downloading or cloning.

  2. Run the install.sh script: The script creates a few directories and sets their permissions.

  3. Edit the export.yml file: The export.yml file contains the WEKAmon and the exporter configuration. Customize the file according to your actual WEKA deployment.

  4. Edit the quota-export.yml file: The quota-export.yml file contains the configuration of the quota-export container. Customize the file according to your actual WEKA deployment.

  5. Start the docker-compose containers: Once done, you can connect to Grafana on port 3000 of the physical server running the docker containers.

1. Obtain the WEKAmon package

The WEKAmon package resides on the GitHub repository. Obtain the WEKAmon package using one of the following methods:

Download the WEKAmon source code

  1. On the latest release section, select the Source Code link to download.

  2. Copy the downloaded source code to the dedicated physical server (or VM) and unpack it.

Clone the repository

Run the following commands to clone the WEKAmon package from GitHub:

git clone https://github.com/weka/weka-mon
cd weka-mon

2. Run the install.sh script

The install.sh script creates a few directories and sets their permissions.

Run the following command:

./install.sh

3. Edit the export.yml file

The WEKAmon and exporter configuration are defined in the export.yml file.

  1. Change the directory to weka-mon and open the export.yml file.

  2. In the cluster section under the hosts list, replace the hostnames with the actual hostnames/IP addresses of the Weka containers (up to three would be sufficient). Ensure the hostnames are mapped to the IP addresses in /etc/hosts.

hosts:
 - hostname01 
 - hostname02
 - hostname03
  1. Optional. In the exporter section, customize the values according to your preferences. For details, see the Exporter configuration options topic below.

  2. Optional. Add custom panels to Grafana containing other metrics.

All other settings in the export.yml file have pre-defined defaults that do not need modification to work with WEKAmon. All the configurable items are defined but marked as comments by an asterisk (#).

To add custom panels to Grafana containing other metrics from the cluster, you can remove the asterisk from the required metrics (uncomment).

Example: In the following snippet of the export.yml, to enable getting the FILEATOMICOPEN_OPS statistic, remove the # character at the beginning of the line.

If the statistic you want to get is in a Category that is commented out, also uncomment the Category line (the first line in the example). Conversely, insert the # character at the beginning of the line to stop getting a statistic.

 'ops_driver':     # Category
   'DIRECT_READ_SIZES':  'sizes'
   'DIRECT_WRITE_SIZES':  'sizes'
#   'FILEATOMICOPEN_LATENCY':  'microsecs'
#   'FILEATOMICOPEN_OPS':  'ops'

4. Edit the quota-export.yml file

The WEKAmon deployment includes a dedicated container named quota-export. The container includes an Alert Manager that emails users when they reach their soft quota.

The configuration of the quota-export container is defined in the quota-export.yml file.

  1. Go to the weka-mon directory and open the quota-export.yml file.

  2. Specify the same hosts as you specified in the export.yml file (see above).

The configuration of the Alert Manager is defined in the alertmanager.yml file found in the etc_alertmanager directory. It contains details about the SMTP server, user email addresses, quotas, and alert rules. To set this file, contact the Customer Success Team.

5. Start the docker-compose containers

  1. Run the following command:

docker-compose up -d
  1. Verify that the containers are running using the following command:

docker ps

Example:

[root@av0412CL-3 weka-mon] 2022-12-05 17:30:37 $ docker ps
CONTAINER ID   IMAGE                               COMMAND                  CREATED          STATUS            PORTS                                       NAMES
ec1d2584acab   grafana/loki:2.3.0                  "/usr/bin/loki -conf…"   20 minutes ago   Up 20 minutes     0.0.0.0:3100->3100/tcp, :::3100->3100/tcp   weka-mon_loki_1
4645533501f0   grafana/grafana:latest              "/run.sh"                20 minutes ago   Up 20 minutes     0.0.0.0:3000->3000/tcp, :::3000->3000/tcp   weka-mon_grafana_1
d930e903b74e   wekasolutions/export:latest         "/weka/export -v"        20 minutes ago   Up 7 minutes      0.0.0.0:8001->8001/tcp, :::8001->8001/tcp   weka-mon_export_1
dc5f9f710997   wekasolutions/quota-export:latest   "/weka/quota-export"     20 minutes ago   Up 7 minutes      0.0.0.0:8101->8101/tcp, :::8101->8101/tcp   weka-mon_quota-export_1
17689ac9377d   prom/prometheus:latest              "/bin/prometheus --s…"   20 minutes ago   Up 20 minutes     0.0.0.0:9090->9090/tcp, :::9090->9090/tcp   weka-mon_prometheus_1
[root@av0412CL-3 weka-mon] 2022-12-05 17:35:46 $ 

If the status of the containers is not up, check the logs and troubleshoot accordingly. To check the logs, run the following command:

docker logs <container id>

Once all containers run, you can connect to Grafana on port 3000 of the physical server running the docker containers. The default credentials for Grafana are admin/admin.

Integrate with an existing Grafana/Prometheus environment

If you already have Grafana and Prometheus running in your environment, you only need to run the exporter and add it to the Prometheus configuration.

1. Obtain the WEKAmon package

Follow the steps in the 1. Obtain the WEKAmon package section.

2. Import the dashboard JSON files

In the Grafana application, import the dashboard JSON files from the directory weka-mon/var_lib_grafana/dashboards. For instructions, see the Import dashboard topic in Grafana documentation.

3. Edit the export.yml and quota-export.yml files

Follow steps 3 and 4 in the above sections.

4. Run the exporter

Do one of the following:

Run the exporter in the docker container

Get and run the container (the export.yml configuration file is already edited).

The following example maps the export.yml configuration file in several volumes in the container:

  • ~/.weka directory to enable the container to read the authentication file.

  • /dev/log to enable entries in the Syslog.

  • /etc/hosts to enable the hostname resolution (a DNS can also be used, if exists in the docker environment).

There are more options; you can run the command with-help or -h for a full description.

# get the container from dockerhub:
docker pull wekasolutions/export

# example of how to run the container
docker run -d --network=host \
  --mount type=bind,source=/root/.weka/,target=/weka/.weka/ \
  --mount type=bind,source=/dev/log,target=/dev/log \
  --mount type=bind,source=/etc/hosts,target=/etc/hosts \
  --mount type=bind,source=$PWD/export.yml,target=/weka/export.yml \
  wekasolutions/export -v

Run the exporter as a compiled binary

  1. Go to https://github.com/weka/export/releases and download the tarball from the latest release.

  2. Copy this file to the physical server (or VM).

  3. Run the exporter as follows (for the description of the command-line parameters, see the Exporter section parameters):

tar xvf export-1.3.0.tar
cd export
./export -v

Run the exporter as a Python script

  1. Do one of the following:

  2. Install the required python modules by running the following command: pip3 install -r requirements.txt

  3. Run the exporter (for the description of the command-line parameters, see the Exporter section parameters):

./export -v

Exporter configuration options in the export.yml file

The exporter section defines the program behavior.

# exporter section
exporter:
  listen_port: 8001
  loki_host: loki
  loki_port: 3100
  timeout: 10.0
  max_procs: 8
  max_threads_per_proc: 100
  backends_only: True

Exporter section parameters

ParameterDescription

listen_port

The Prometheus listening port. Do not modify this port unless you modify the Prometheus configuration.

loki_host

If using the Weka-mon setup, do not modify the hostname. Leave blank to disable sending events to Loki.

loki_port

If using the Weka-mon setup, do not modify the port.

timeout

The max time in seconds to wait for an API call to return. The default value is sufficient for most purposes.

max_procs and max_threads_per_proc

Define the scaling behavior. If the number of hosts (servers and clients) exceeds max_threads_per_proc, the exporter runs more processes accordingly. Example: a cluster with 80 Weka servers and 200 compute nodes (aka clients) has 280 hosts. With the default max_threads_per_proc of 100, it runs 3 processes (280 / 100 ~ 3). It's recommended to have 1 available core per process. In this cluster example, deploy at least 4 available cores on the server/VM.

backends_only

Run only on the Weka backend hosts

The exporter always tries to allocate one host per thread but does not exceed the maximum processes specified in the max_procs parameter. In a cluster with 1000 hosts, it doubles or triples up the hosts on the threads.

Example:

In a cluster with 3000 hosts, max_procs = 8, and max_threads_per_proc= 100, only 8 processes running. Each process with 100 threads, but there are close to 4 hosts serviced per thread instead of the default 1 host.

Last updated