Manage events using the GUI
This page describes how to manage events using the GUI.
With the GUI, you can:
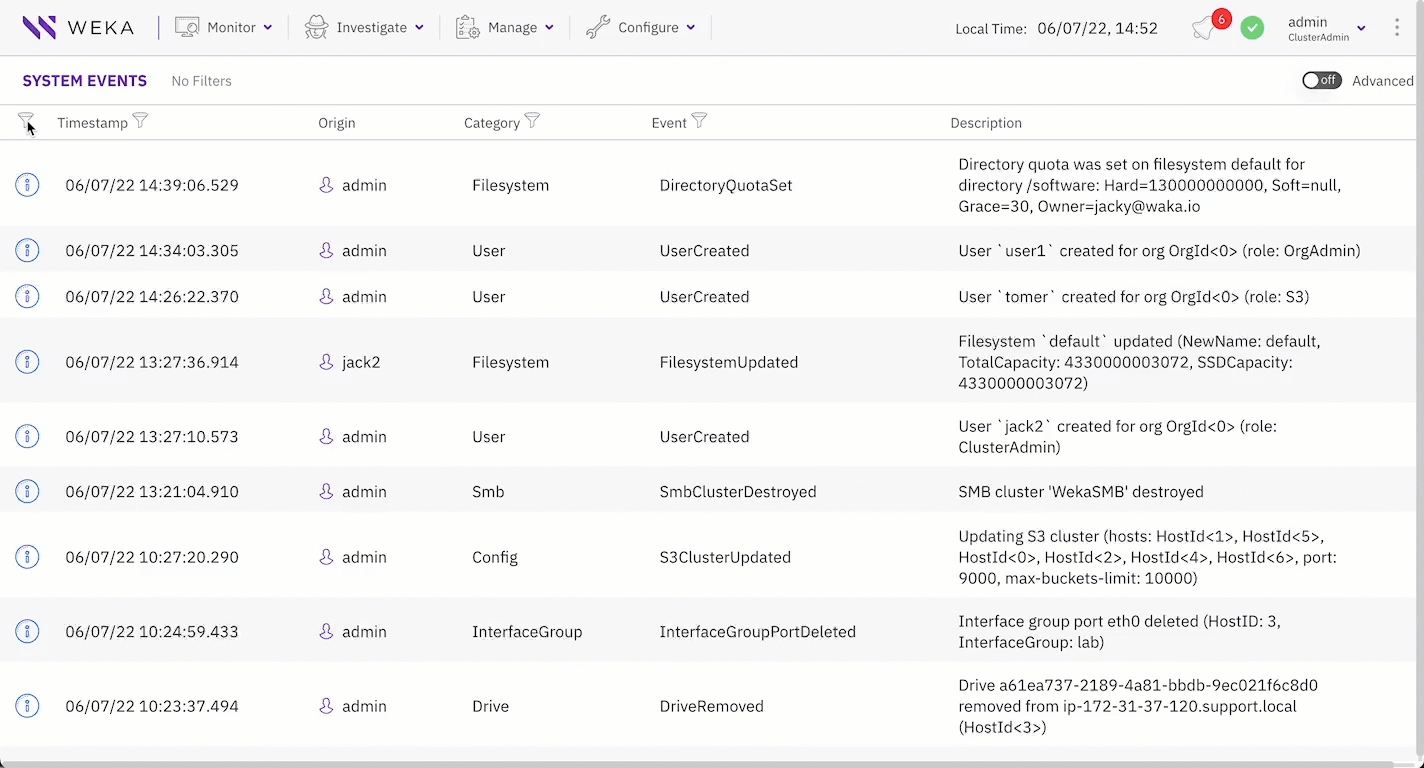
View events
The events enable you to investigate issues that occur in the system.
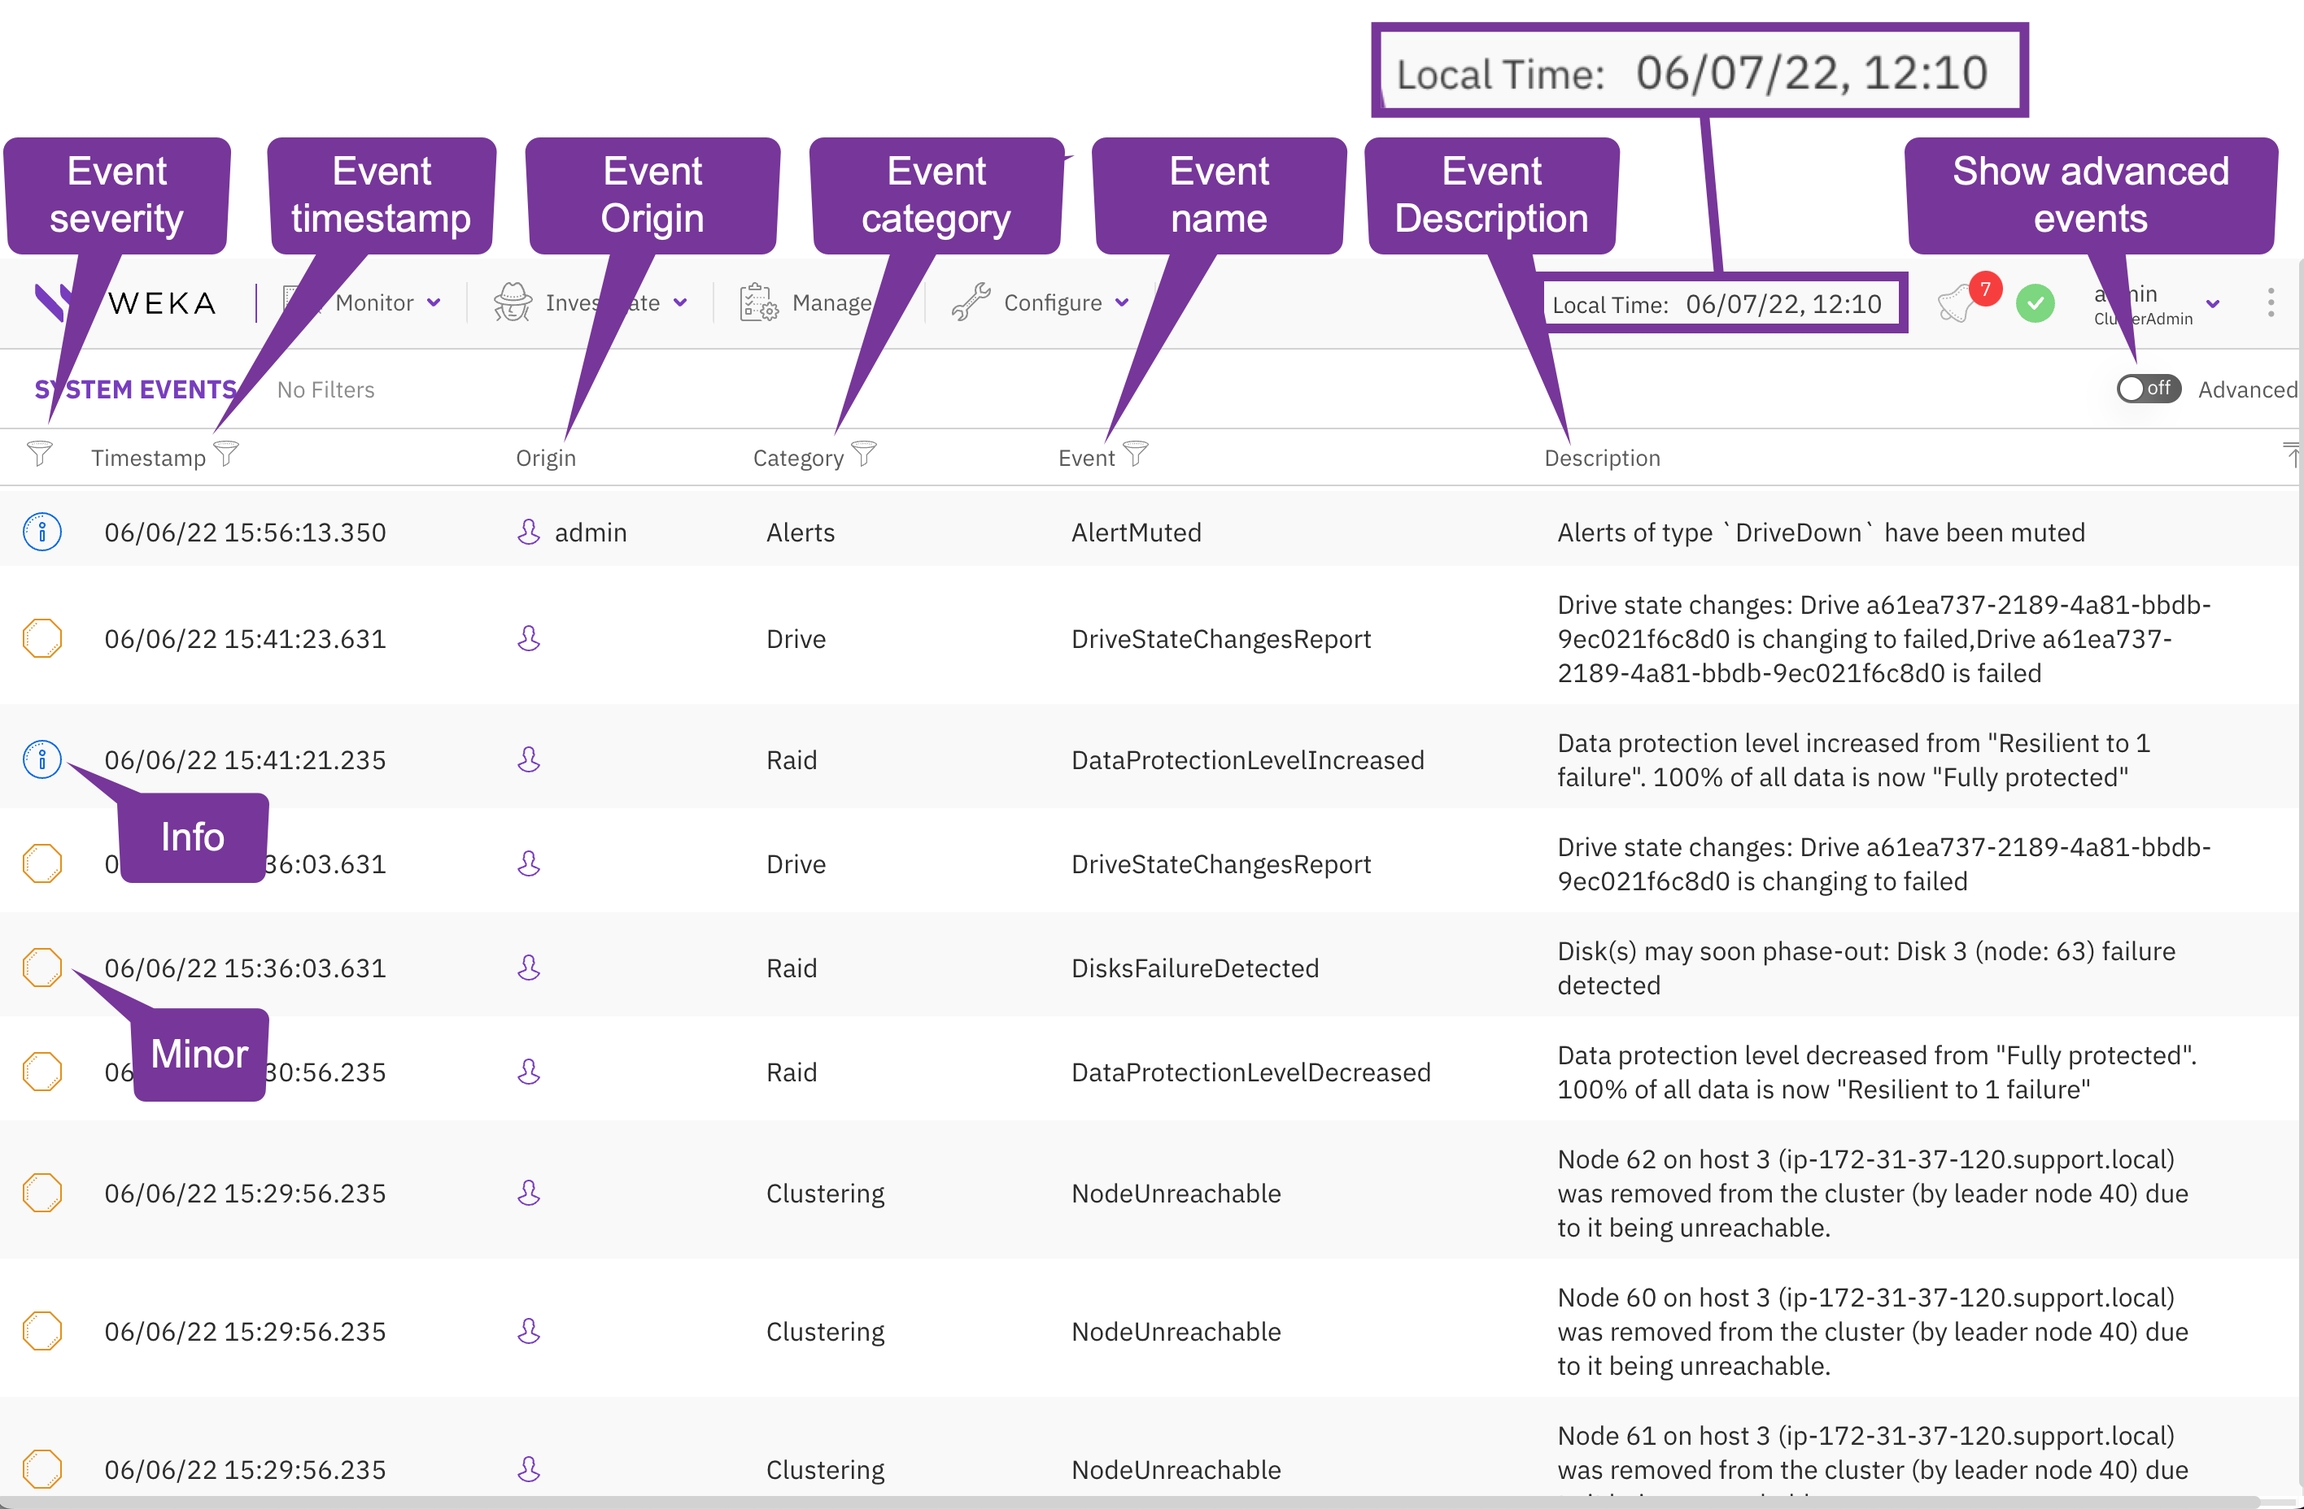
The System Events page provides the following details:
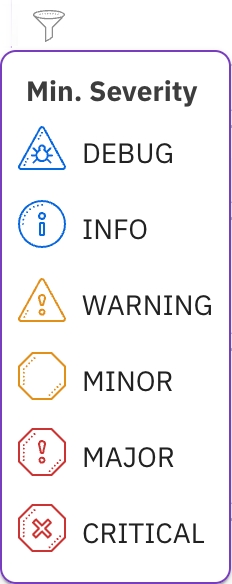
Severity: The severity of the event. The options are Info (lowest), Warning, Minor, Major, and Critical (highest).
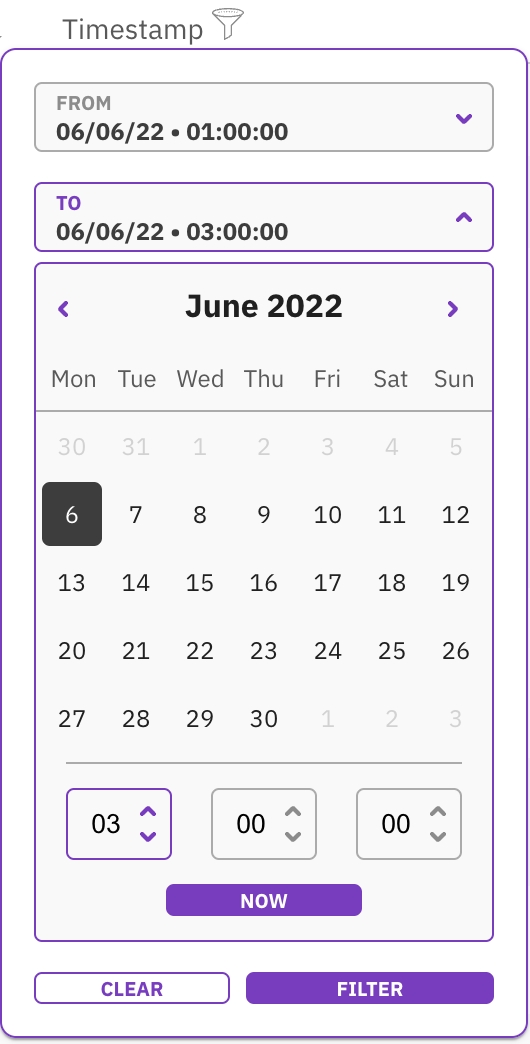
Timestamp: The date and time the event occurred. You can switch the display time between local and system time through the top bar.
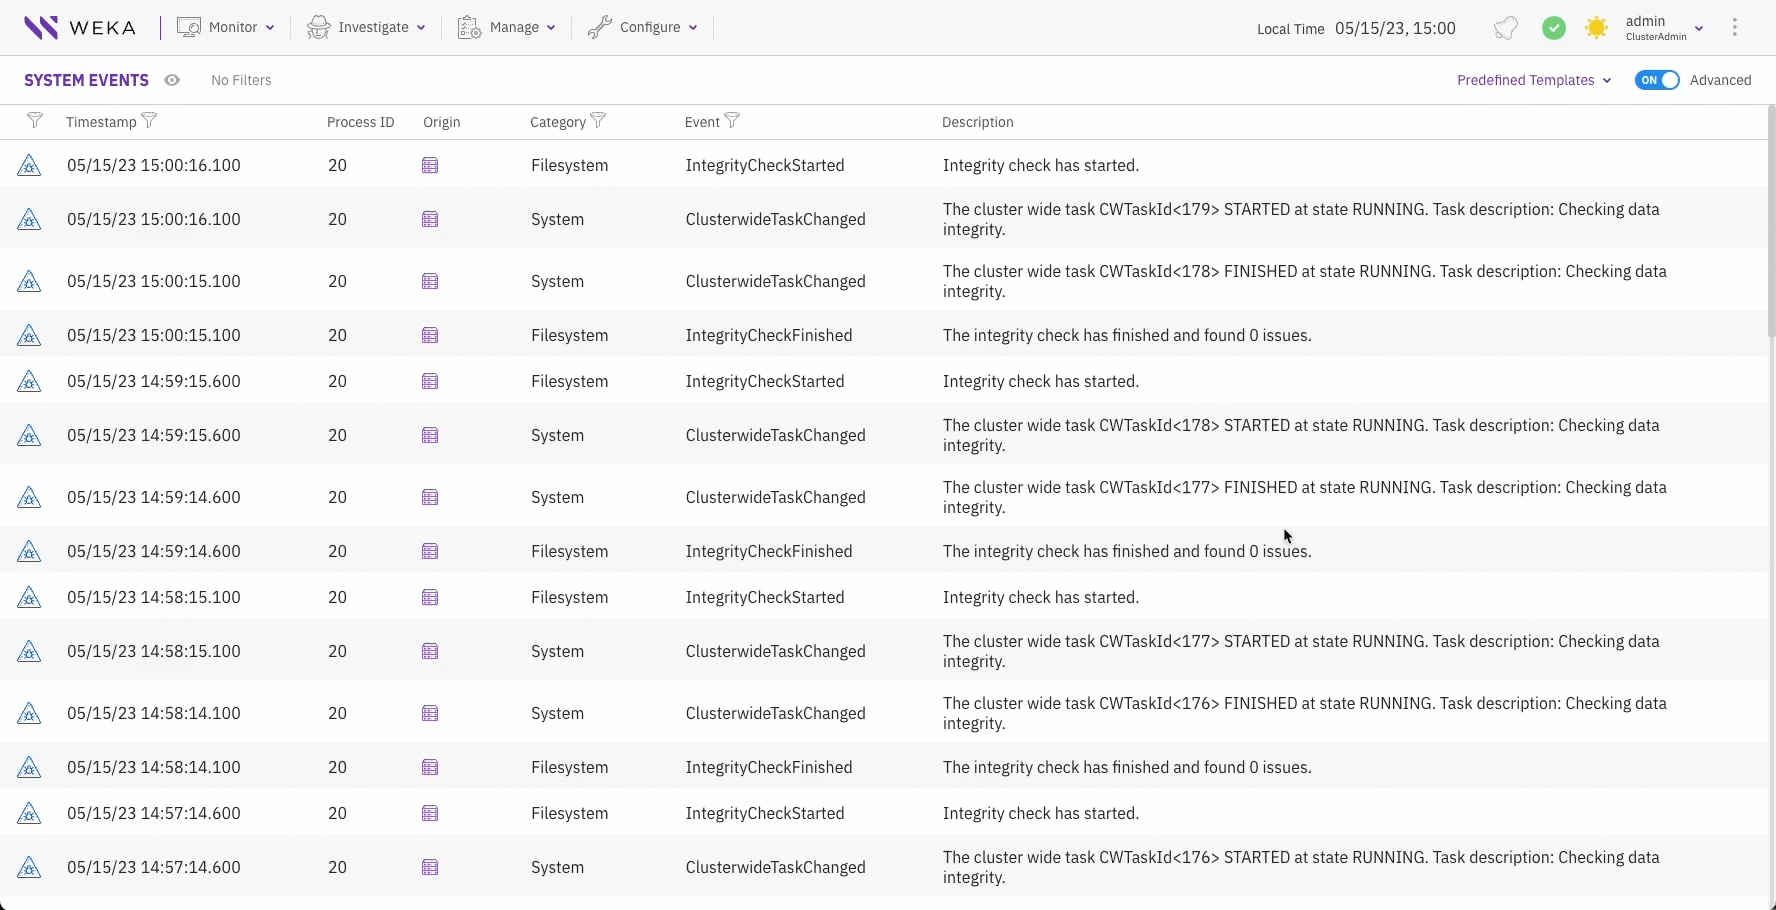
Process ID: The process ID created the event.
Origin: The event's originator, such as a user, backend, or cluster. For example, when a user creates a filesystem, the username appears as the event's originator.
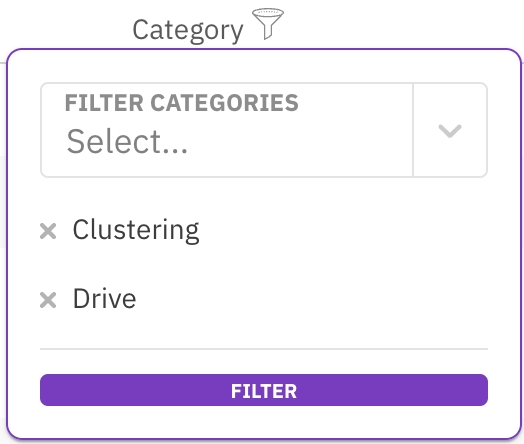
Category: The category options include Alerts, Cloud, Clustering, Config, Custom, Drive, Events, Filesystem, InterfaceGroup, Kms, Licensing, NFS, Network, Node, ObjectStorage, Org, Raid, Resources, S3, Security, Smb, System, Traces, Upgrade, and User.
Name: The name of the event.
Description: The description of the event.
You can select the Advanced switch to display internal events. This option is helpful for experts investigating internal issues.
Procedure
From the menu, select Investigate > Events.
Filter events
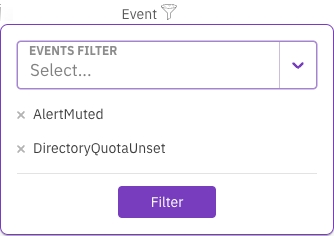
You can filter the events according to the event severity, timestamp, category, or event name. You can also filter events by multiple categories and multiple event names.
Procedures
Display events by a predefined template
You can display events according to predefined templates based on a combination of event names with the same logical context. For example, selecting the Processes template displays all events related to processes. A predefined template enables focusing on certain areas of the system.
The predefined templates include protocols, object store, cluster-wide tasks, filesystems, quota, snapshots, clients, and processes.
Procedure
In the Events page, select Predefined Templates.
Select from the list the required template to display.
Related topic
Last updated
